
28
Jul
Abstract
A key part in the regulatory approval of any satellite system is to successfully coordinate the radio frequency assignments involved. This process is defined by national and international regulations, in particular, those of the International Telecommunications Union within the Radio Regulations. This process can seem daunting to those not familiar with it, and requires understanding of regulations, procedures, databases, radio engineering and modelling techniques. This White Paper describes some of the key aspects, such as the ITU process, the databases involved, how to identify whether coordination is required and the detailed coordination process. It shows how these tasks can be supported using the Visualyse suite of tools available from Transfinite Systems.
Introduction
The space economy is booming. The lowering of satellite and launch costs has led to an explosion of interest in operating satellites in non-geostationary orbit (non-GSO), in particular low Earth orbit (LEO). These can provide a range of services from broadband communications, voice services, internet of things (IoT), navigation, earth observation, space situation awareness, in-orbit servicing, science, astronomy and many others. There have been new entrants, as in new countries gaining space capabilities, new companies and new people.
A common factor in all these satellite systems is their use of radio waves, whether for communications, satellite telemetry command and control (TT&C), observation, navigation or detection. Uncontrolled access to radio frequencies can lead to harmful interference, and it was to avoid this that a regulatory framework has been created, both at the national and international level. The international level is particularly important for satellite systems that by their nature cross national boundaries and can cover large parts, if not all, of the world.
They key global regulatory body is the International Telecommunication Union (ITU), the oldest of the United Nation’s specialised agencies, formed in 1865 as the International Telegraph Union. For satellite systems, a key task within the ITU regulatory framework is that of “coordination”. This is a step that involves procedures, data bases and numerical analysis that must be undertaken to ensure a new system will not cause harmful interference into existing systems.
Completing this coordination task is necessary to get regulatory approval at both a national and international level, and hence can make or break satellite systems. But what is coordination and how can a non-GSO satellite operator achieve it?
This White Paper introduces the concepts of satellite coordination, focusing on the requirements to coordinate a non-GSO satellite system. It describes the ITU coordination process, in particular the two key steps of:
- Identification of where coordination is required
- Undertaking detailed coordination with another satellite operator.
These two steps can be supported by the use of software such as Visualyse Professional to undertake the simulations required as part of the detailed coordination process.
The example used in this White Paper, as described in Example Non-GSO System, involves a single non-GSO satellite, but Large Constellation Coordination describes how the process also applies to large constellations such as SpaceX’s Starlink, OneWeb or Amazon’s Kuiper.
Note that in some bands there are additional regulatory requirements. For example, in some of the bands that non-GSO satellite systems are sharing with GSO systems there are Equivalent Power Flux Density (EPFD) limits. The steps that are required to check against these limits, as described in EPFD Analysis, require two additional software tools:
- Visualyse PMGT (PFD Mask Generator Tool) to develop the power flux density (PFD) masks required to complete filings in bands where there are EPFD limits
- Visualyse EPFD: to determine whether a non-GSO system meets the EPFD limits in Article 22.
There are also specialised procedures and calculation methods to coordinate GSO and non-GSO satellite networks, which can be supported using the following software tool:
- Visualyse GSO: to support the coordination of GSO and non-GSO satellite networks.
Note that the Earth station (ES) used by satellite systems can also require coordination, and this can be assisted by analysis undertaken using tools such as Visualyse Professional.
Example Non-GSO System
Sources of Data
For this example we’ll use a real system called Falconeye. All information used in this White Paper is based upon public domain information, in particular the databases published by the ITU in Geneva. These databases were examined using the ITU’s SpaceQuery and SpaceCap tools.
In addition, the data was imported into the Visualyse GSO Network Editor which can also consider non-GSO networks and allows easy navigation between beams and data elements:
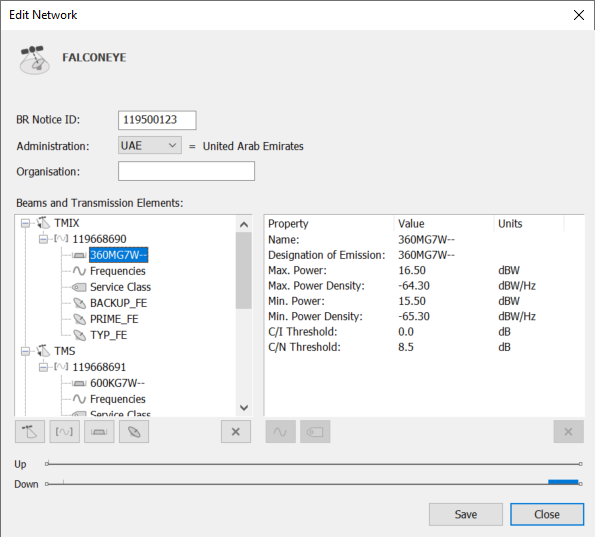
The data structure is described further in ITU Database Structure .
In some cases it can be helpful to augment data in the ITU filing with that from other sources, in particular, the FCC applications Technical Narrative can be a useful resource.
Satellite Orbit
The Falconeye orbit data is as follows:
| Height, h | 611 km |
| Eccentricity, e | 0 |
| Inclination, i | 97.8° |
These parameters suggest the system could be sun-synchronous, though accurate selection of orbit elements is required to model that correctly.
Satellite Beams
The satellite beam data is as shown in the table below:
| Satellite Beam | TMIX | TMS | TCS |
|---|---|---|---|
| Direction | Downlink | Downlink | Uplink |
| Frequency | 8,205 MHz | 2,264.5 MHz | 2,085.23 MHz |
| Bandwidth | 360 MHz | 600 kHz | 400 kHz |
| Satellite peak gain | 6.2 dBi | 3 dBi | 2 dBi |
| Satellite maximum power | 16.5 dBW | -2.9 dBW | - |
| Satellite receive temperature | - | - | 800 K |
| C/N threshold (dB) | - | - | 12.0 dB |
Earth Stations
The databases provide details for a number of different Earth Stations (ESs), but the table below is based upon the PRIME_FE class giving the values used for each of the satellite beams above.
| Satellite Beam | TMIX | TMS | TCS |
|---|---|---|---|
| Direction | Downlink | Downlink | Uplink |
| Frequency | 8,205 MHz | 2,264.5 MHz | 2,085.23 MHz |
| Bandwidth | 360 MHz | 600 kHz | 400 kHz |
| ES peak gain | 51.3 dBi | 40.1 dBi | 39.4 dBi |
| ES beamwidth | 0.39° | 1.68° | 1.82° |
| ES Gain pattern | Rec. ITU-R S.465 | Rec. ITU-R S.465 | Rec. ITU-R S.465 |
| ES maximum power | - | - | 18.5 dBW |
| ES receive temperature | 150 K | 300 K | - |
| C/N threshold (dB) | 8.5 dB | 5.2 dB | - |
A number of locations were provided for the specific ES, but the PRIME_FE was located at the following position:
| Latitude | 24.4 °N |
| Longitude | 54.3833 °E |
ITU Coordination
This section gives an overview of the ITU’s satellite coordination process, including identification, if coordination is required and the databases involved. It shows the process using the example non-GSO system described in Example Non-GSO System using the Visualyse GSO tool.
ITU Process
The ITU contains three sectors, Radiocommunication, Standardisation and Development, and the coordination process is managed under the first of these, the ITU-R and the ITU’s Radiocommunications Bureau, known as the BR. The ITUR has created a framework of regulations, most importantly the Radio Regulations (RR), a treaty level legal instrument that is updated at World Radiocommunication Conferences (WRCs). There are also associated documents such as ITU-R Recommendations and the Rules of Procedure (RoP).
One of the key parts of the process is the non-GSO system’s filing. This is a technical description of the system with sufficient parameters for others to undertake an assessment of whether it could cause harmful interference into their system. Typically, this is provided in a database submitted to the ITU using the Appendix 4 format in ITU Database Structure, and the date at which that database is submitted to the ITU is a key part of the process. The filing must be submitted by a national regulator, so a satellite operator must work within a country using the nation’s regulatory procedures. There is effectively a queue of filings, operating on a first-come, first served basis, so that those that arrived earlier have a degree of priority over those that are submitted later.
The ITU will check a filing against a set of criteria, such as Article 5 of the RR which allocates services to specific frequency bands. Examples of services include Mobile Satellite Service (MSS) or Earth Exploration Satellite Service (EESS). The filing must identify the service the non-GSO system intends to operate under and which frequencies it will transmit on: the ITU will then check this information against the allocations in Article 5 to make sure they are consistent.
Having passed these initial checks, the ITU will publish the filing, allowing other organisations – administrations (i.e. countries) and satellite operators - to examine it and identify if they think that coordination is required using the criteria in Identifying if Coordination is Required contained within Appendix 5 (and for other cases also in Appendix 7 and 8).
The publication date also starts the clock for other procedures, such as the requirement to bring into use (BIU) the frequencies in the filing with up to 7 years permitted before the satellites of a constellation are launched as described in Resolution 35.
The new satellite network will then undertake coordination with potentially affected systems that were filed earlier with the ITU. Once coordination is complete with all potentially affected parties, and the BR informed, then the satellite network can be entered in the Master International Frequency Register (MIFR), giving regulatory recognition of the system and the need to protect it.
These previously filed networks must give their agreement that coordination has been achieved for a system to be able to enter the MIFR. The methods used during coordination are to be agreed between the parties themselves. This is described in the RR, in particular in Article 9 as follows:
9.50.1 In the absence of specific provisions in these Regulations relating to the evaluation of interference, the calculation methods and the criteria should be based on relevant ITU-R Recommendations agreed by the administrations concerned. In the event of disagreement on a Recommendation or in the absence of such a Recommendation, the methods and criteria shall be agreed between the administrations concerned. Such agreements shall be concluded without prejudice to other administrations.
9.53 Thereafter, the requesting and responding administrations shall make every possible mutual effort to overcome the difficulties, in a manner acceptable to the parties concerned.
9.54 Either the administration seeking coordination or one whose assignments may be affected thereby may request additional information which it may require in order to assess the interference to its own assignments or to assist in resolving the matter.
9.59 If there is disagreement between the administration seeking coordination and an administration with which coordination is sought concerning the level of acceptable interference, either may seek the assistance of the Bureau; in such a case, it shall provide the necessary information to enable the Bureau to endeavour to affect such coordination.
The coordination process is therefore very flexible but also critical to providing a non-GSO satellite system with regulatory recognition and protection from harmful interference.
ITU Database Structure
The filing is a key part of the regulatory process as it defines the characteristics of the proposed non-GSO system before it is launched in sufficient detail that other parties can undertake an assessment of whether it could cause harmful interference. The data is provided in a Microsoft Access .MDB database with format and field contents defined by a number of documents:
- Appendix 4 of the Radio Regulations
- Recommendation ITU-R SM.1413: Radiocommunication Data Dictionary for notification and coordination purposes
- Preface to the BR IFIC.
The figure below gives a simplified view of the main database tables and relationships:

The key tables are:
- notice: the ntc_id = notice id is the unique identifier for all information about a particular system and is the primary key used to connect the various tables together. This table also includes status information, key dates, the filing administration and the relevant provisions of the RR
- non_geo: this gives the satellite name and the reference body around which the satellite orbits. For example, “T” = Terra or Earth. Other parameters in this table are used for an EPFD examination under Article 22
- orbit: this defines one plane of an orbit, such as its inclination angle, right ascension, and heights of apogee and perigee. Note that the radius of the Earth is not defined, though Recommendation ITU-R S.1503 and others use a value of around 6378.1 km.
- phase: this identifies where satellites are within the orbit plane using a field called phase_ang. Recommendation ITU-R S.1503 identifies this as the sum of the argument of perigee and true anomaly.
- s_beam: this defines a satellite beam with associated peak gain and whether it is used to transmit or receive
- grp: the group is a container that links the associated tables of freq, emiss, e_as_stn etc. It can also contain additional information such as receive noise temperature, total frequency ranges / bandwidths and minimum elevation angles.
- freq: this contains the various transmit frequencies associated with this beam and group
- emiss: this defines the carrier bandwidths and powers, both minimum and maximum in both per Hertz and also within the bandwidth. There are also threshold C/I and C/N levels.
- e_as_stn: the associated Earth Station table contains information about the ES including the antenna gain pattern, peak gain and beamwidth. It can also include latitude and longitude of a specific site.
There is also a variation on the e_as_stn table which is for typical ES values where specific latitudes and longitudes are not given.
Filings must be created using this data structure using tools such as the ITU’s SpaceCap package, assisted by the Visualyse GSO Network Editor tool. The ITU also provides The BR’s Space Information System’s (SIS) validation tool can be used to check and validate a filing in the database before submission.
The ITU publishes two types of database:
- The International Frequency Information Circular (IFIC): this is published every two weeks and contains an update of those filings received since the last IFIC
- The Space Radiocommunication Stations (SRS): this is a very large set of MDB files that contains all the filings received or in the MIFR.
More information about these databases and associated software tools is available at the ITU web site:
https://www.itu.int/ITU-R/go/space-brific/en
https://www.itu.int/ITU-R/go/space-preface/en
https://www.itu.int/ITU-R/go/space-software/en
Identifying if Coordination is Required
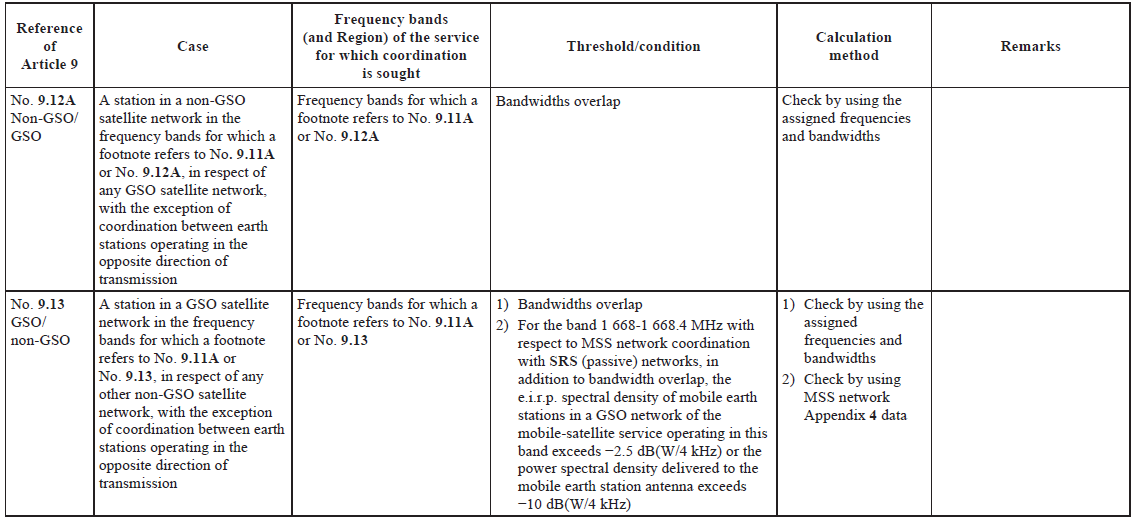
The coordination requirements depend upon the service and frequency bands the system proposes to use. These are defined in Appendix 5 of the Radio Regulations, which looks a bit like this:
Basically, between non-GSO systems, the key trigger is bandwidth overlap: as long as there is bandwidth overlap between any of the emissions of the two filings, then coordination could be required.
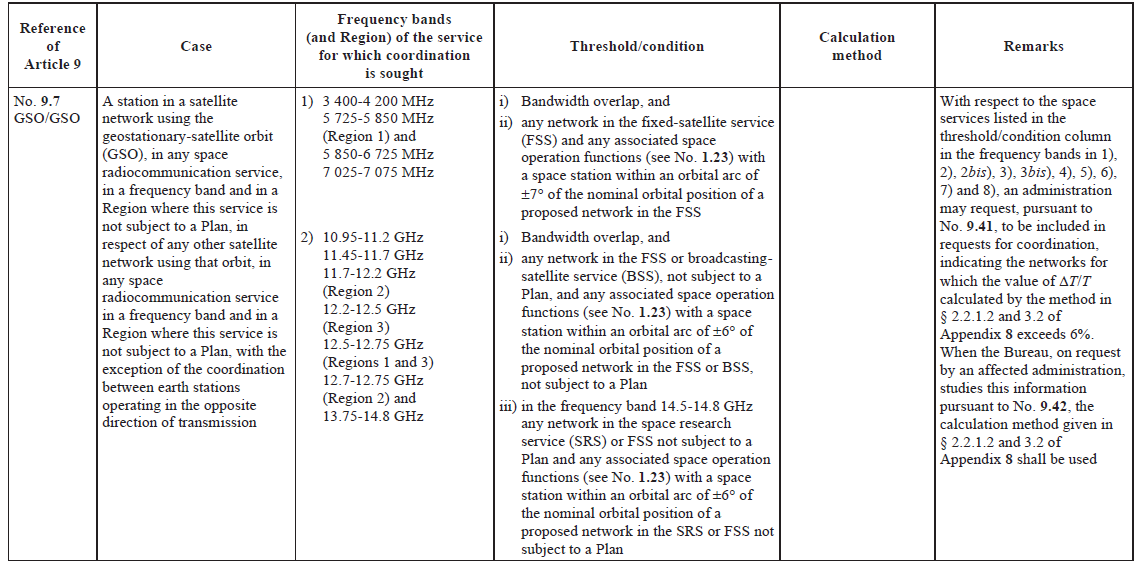
For other systems, there can be other types of coordination trigger. For example between GSO systems it can be a combination of frequency overlap, separation on the GSO arc and calculated values of the DT/T:
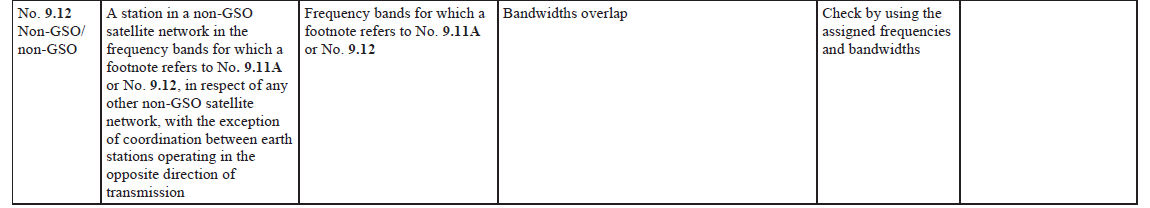
In bands that are shared between GSO and non-GSO systems, there are two possible approaches:
- In some bands there are EPFD limits, in which case coordination is not required but the non-GSO system must meet the EPFD limits in Article 22
- In other bands coordination is required, as shown in the figure below:
When coordination is required, it is then necessary to go into detailed coordination with another satellite operator, as described in the next section.
Detailed Coordination
Introduction
The coordination trigger process is deliberately conservative in that it aims to avoid missing cases that could cause harmful interference. The aim of coordination is to:
- Undertake an assessment of whether there is a real problem of harmful interference or not
- If there is a potential for harmful interference, identify ways to mitigate it so that both systems can operate without significant degradation in the services they provide.
These two steps typically require interference analysis: building models of the two systems in simulation tools and comparing resulting metrics against suitable thresholds.
Non-GSO satellite systems are by their nature dynamic, in that the spacecraft moves and hence the interference geometry changes. Therefore, typically the analysis needs methodologies such as time dynamic, though suitable Monte Carlo methods could also be used. This type of analysis can be made quick, easy and accurate using simulation tools such as Visualyse Professional.
Simulating with Visualyse Professional
Visualyse Professional is a flexible simulation tool that can model a wide range of radio communication systems and use a wide range of modelling methodologies, including static, area, dynamic, Monte Carlo and more. It uses an object structure of Antennas, Beams, Stations, Carriers Links, Interference Paths that can be combined in an unlimited number of ways to create anything from a 5G network to Starlink, from systems involving a single satellite to those including thousands.
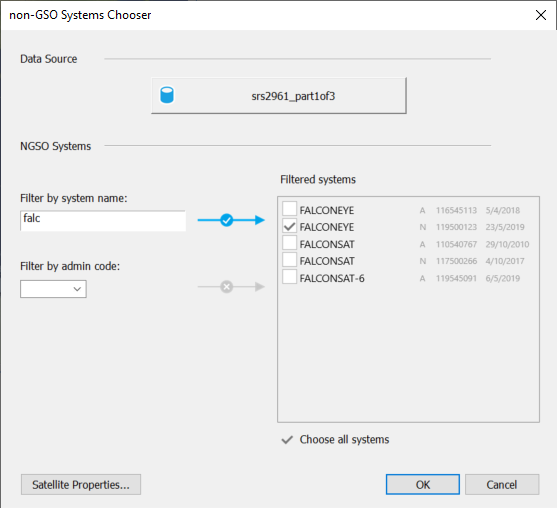
Visualyse Professional is used by many satellite operators to undertake the types of studies required to support non-GSO satellite coordination. It includes features to read satellite orbit data directly from the SRS:
There are also:
- Libraries of pre-coded gain patterns, including those from ITU-R Recommendations such as S.465, S.580, S.672, S.1428, S.1528 etc.
- Libraries of pre-coded propagation models, including those from ITU-R Recommendations such as those in P.525, P.618 and P.676 for Earth-to-space paths and P.452, P.1812 and P.2001 for terrestrial paths
- Satellite selection methods or tracking strategies, using logic such as minimum elevation angle, GSO arc exclusion zone, avoid pointing towards satellites of another system, longest hold time etc.
- Ability to calculate link metrics such as {C, I, C/I, C/N, C/(N+I), I/N, PFD/EPFD} and associated derived statistics including availability / unavailability and throughput
- Ability to model power control algorithms, beamforming antennas and both co-frequency and non-frequency scenarios
- Ability to undertake analysis between satellite systems (e.g. for satellite coordination) or between Earth/terrestrial stations (e.g. for Earth Station coordination) using terrain and clutter databases
- Orbit prediction models such as point mass, point mass plus J2 and SGP4 / SDP4 (*)
- Ability to set orbits to be Sun synchronous and include the impact of the Doppler shift of frequencies (*)
- Ability to set time step down to 1 millisecond or use Monte Carlo methods
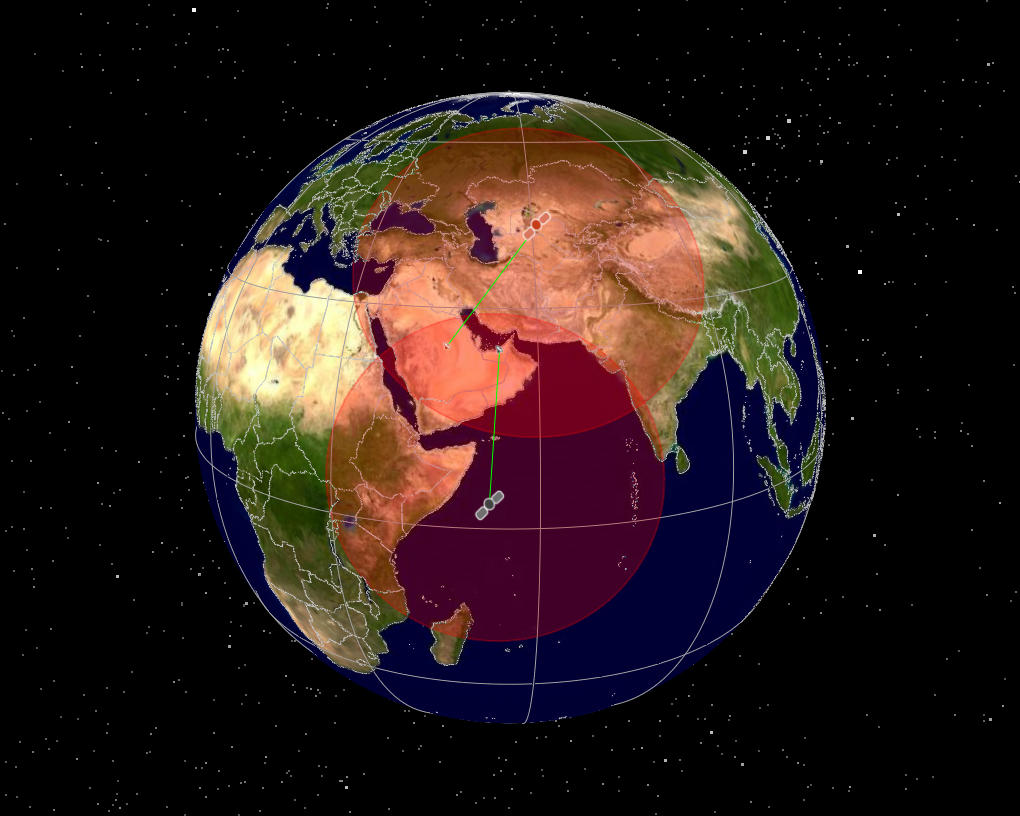
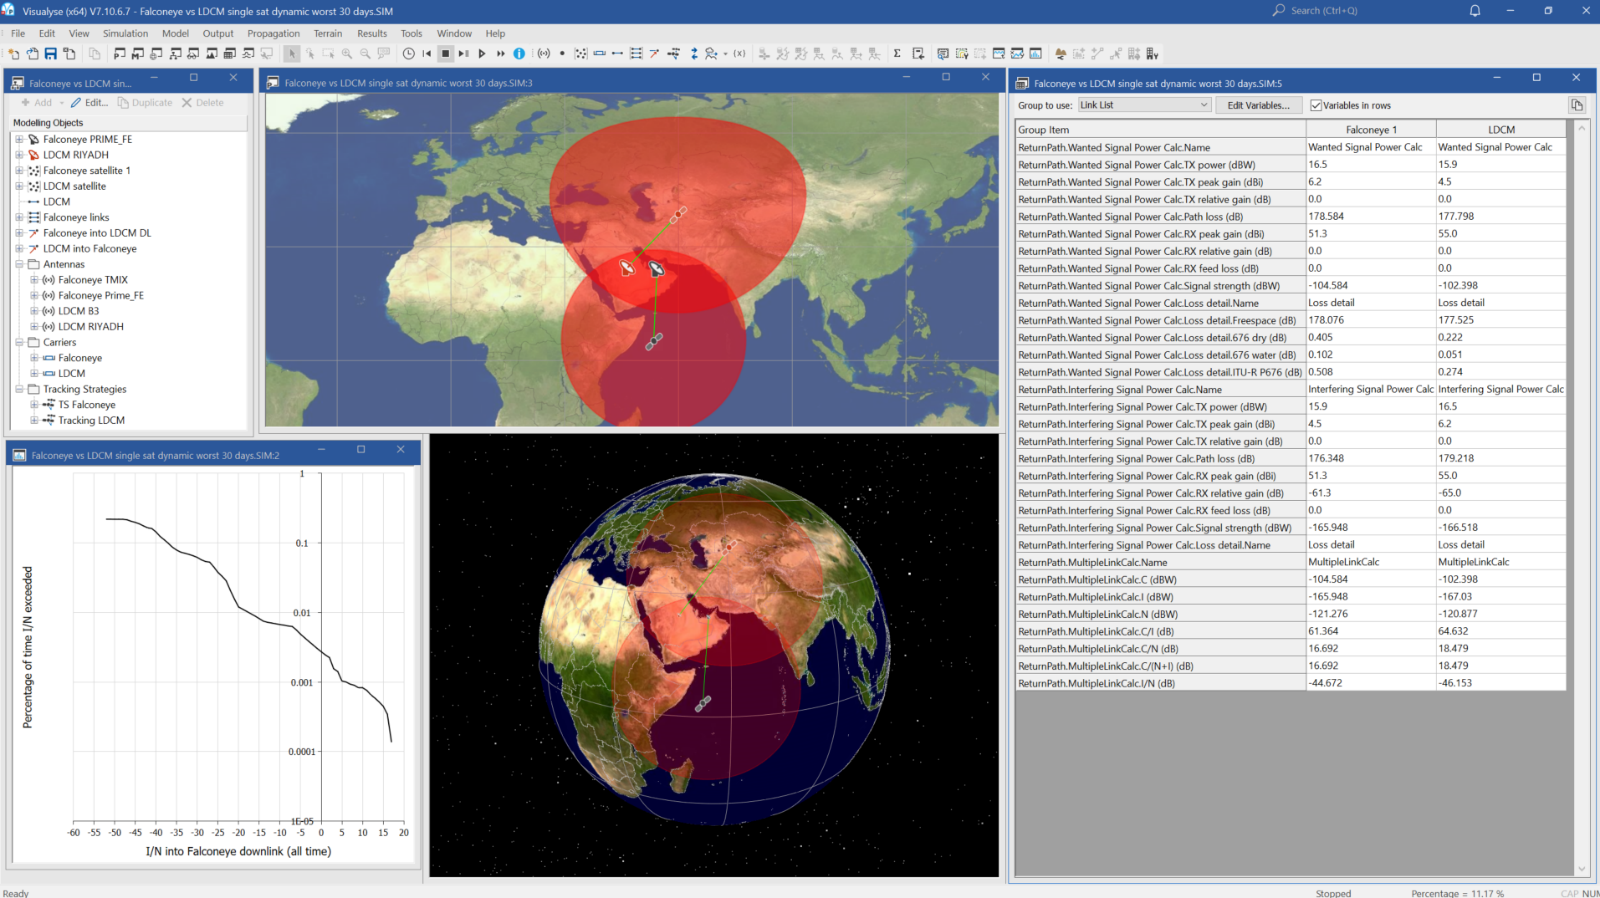
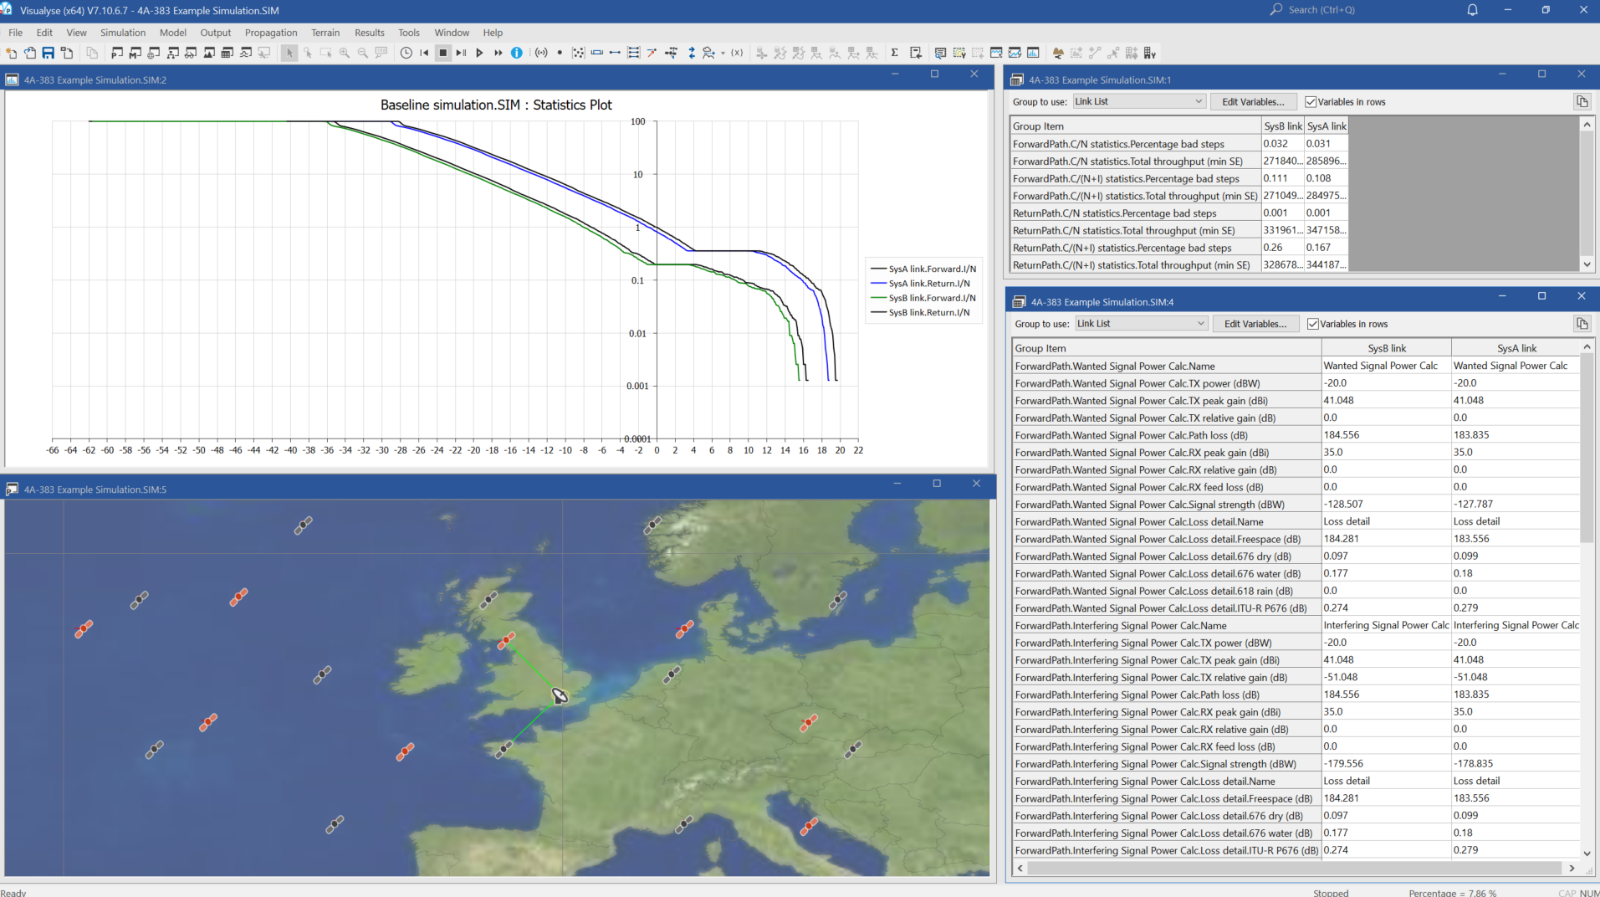
- Visualization tools including charting, 2D maps and 3D views, as in the figure below:
(*) Available in the Visualyse Interplanetary version of Visualyse Professional
The result is the ability to quickly and accurately model a wide range of radiocommunication systems. In particular, it is uniquely capable of undertaking the coordination of non-GSO satellite systems:
But how can the results generated by Visualyse Professional be used during the coordination process? To answer that, first let’s look at how interference is taken into account during the link design process.
Link Design, Interference Margin and Thresholds
One way to consider the impact of interference during the link design process is via a diagram similar the one below, taken from the book Interference Analysis, Modelling Radio Systems for Spectrum Management, by Transfinite’s John Pahl, published by Wiley.

In this figure, higher lines represent greater power density. The starting point is the N = receiver noise line and the target C/(N+I) required to provide the intended service. It is also necessary to consider the impact of interference during link design, otherwise any actual interference during operation would reduce the quality of service below the target levels.
Hence it is usual to add a margin for interference, to get the = noise plus interference line. A value such as 1 dB is typical, but others could be used. The link can then be designed "upwards" of this line using the target C/(N+I) and additional margins, e.g. for propagation and system losses.
With a 1 dB interference margin, this equates to an aggregate I/N of about -6 dB. But how to determine what the single entry I/N threshold should be? One way would be to say there could be 4 equal sized single-entry interferers contributing to the aggregate, and hence the single entry I/N can be calculated using:
However, this represents a static number, and non-GSO systems move, and this must be included in the threshold. This can be done in a number of ways, including:
- Having short-term and long-term I or I/N thresholds
- Impact of interference on unavailability
- Impact of interference on throughput.
Examples of defining short-term and long-term interference thresholds can be found in a number of ITU-R Recommendations. An example of this would be those in Recommendation ITU-SA.1027-6: Sharing criteria for space-to-Earth data transmission systems in the Earth exploration-satellite and meteorological-satellite services using satellites in low-Earth orbit, as in the table below:
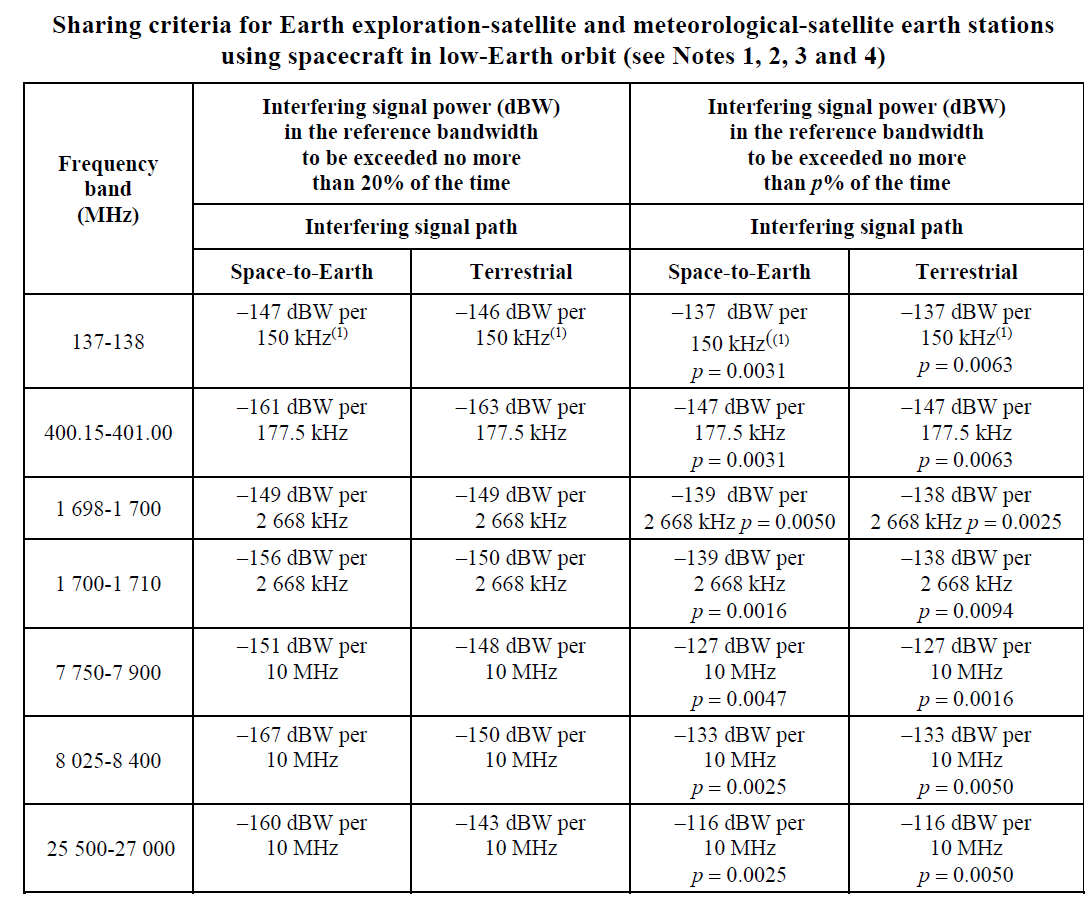
These are based upon aggregate interference thresholds in Recommendation ITU-R SA.1026, using apportionment based upon division in time for the short-term and power for the long-term.
An example of using unavailability and throughput is given in Article 22.5L which gives the following criteria for non-GSO systems causing interference into GSO networks in Q/V band using the methodology in Resolution 770:
- a single-entry increase of 3% of the time allowance for the C/N value associated with the shortest percentage of time specified in the short-term performance objective of the generic geostationary-satellite orbit reference links; and
- a single-entry permissible allowance of at most 3% reduction in time-weighted average spectral efficiency calculated on an annual basis for the generic geostationary-satellite orbit reference links using adaptive coding and modulation.
Using this approach to link design and metrics from suitable ITU-R sources including Recommendations, it is possible to assess the impact of interference using simulation tools such as Visualyse Professional.
Active Time vs Total Time Statistics and Sun Synchronous Orbits
The table in Link Design, Interference Margin and Thresholds above gave sharing criteria for various satellite systems for short-term and long-term percentages. For example, in X-band these would be:
- Short-term: Interference of -133 dBW/10 MHz or greater for at most p = 0.025% of the time
- Long-term: Interference of -167 dBW/10 MHz or greater for at most p = 20% of the time
But what is meant by “of the time”? Two metrics could be considered:
- Percentage of the total simulation time
- Percentage of the simulation time for which a link was active.
For some systems, such as large non-GSO constellations, the link should always be active, hence these metrics will be the same, but for single satellite systems there could be a significant difference. For example, some links with a single satellite and single ES could only be active for only 2% of the time and hence the statistics could vary by a factor of nearly 50.
Given that what is important is interference during a link’s operation, it is likely that the statistics should be gathered over the percentage of time that a link is active.
Another question is the run time used to generate the resulting statistics, such as the complementary cumulative distribution function (CCDF) of interference. There could be significant differences between:
- The statistics over a 10 year period
- The statistics over the 30 day period that causes the highest interference.
An example of this is shown in the graph below:
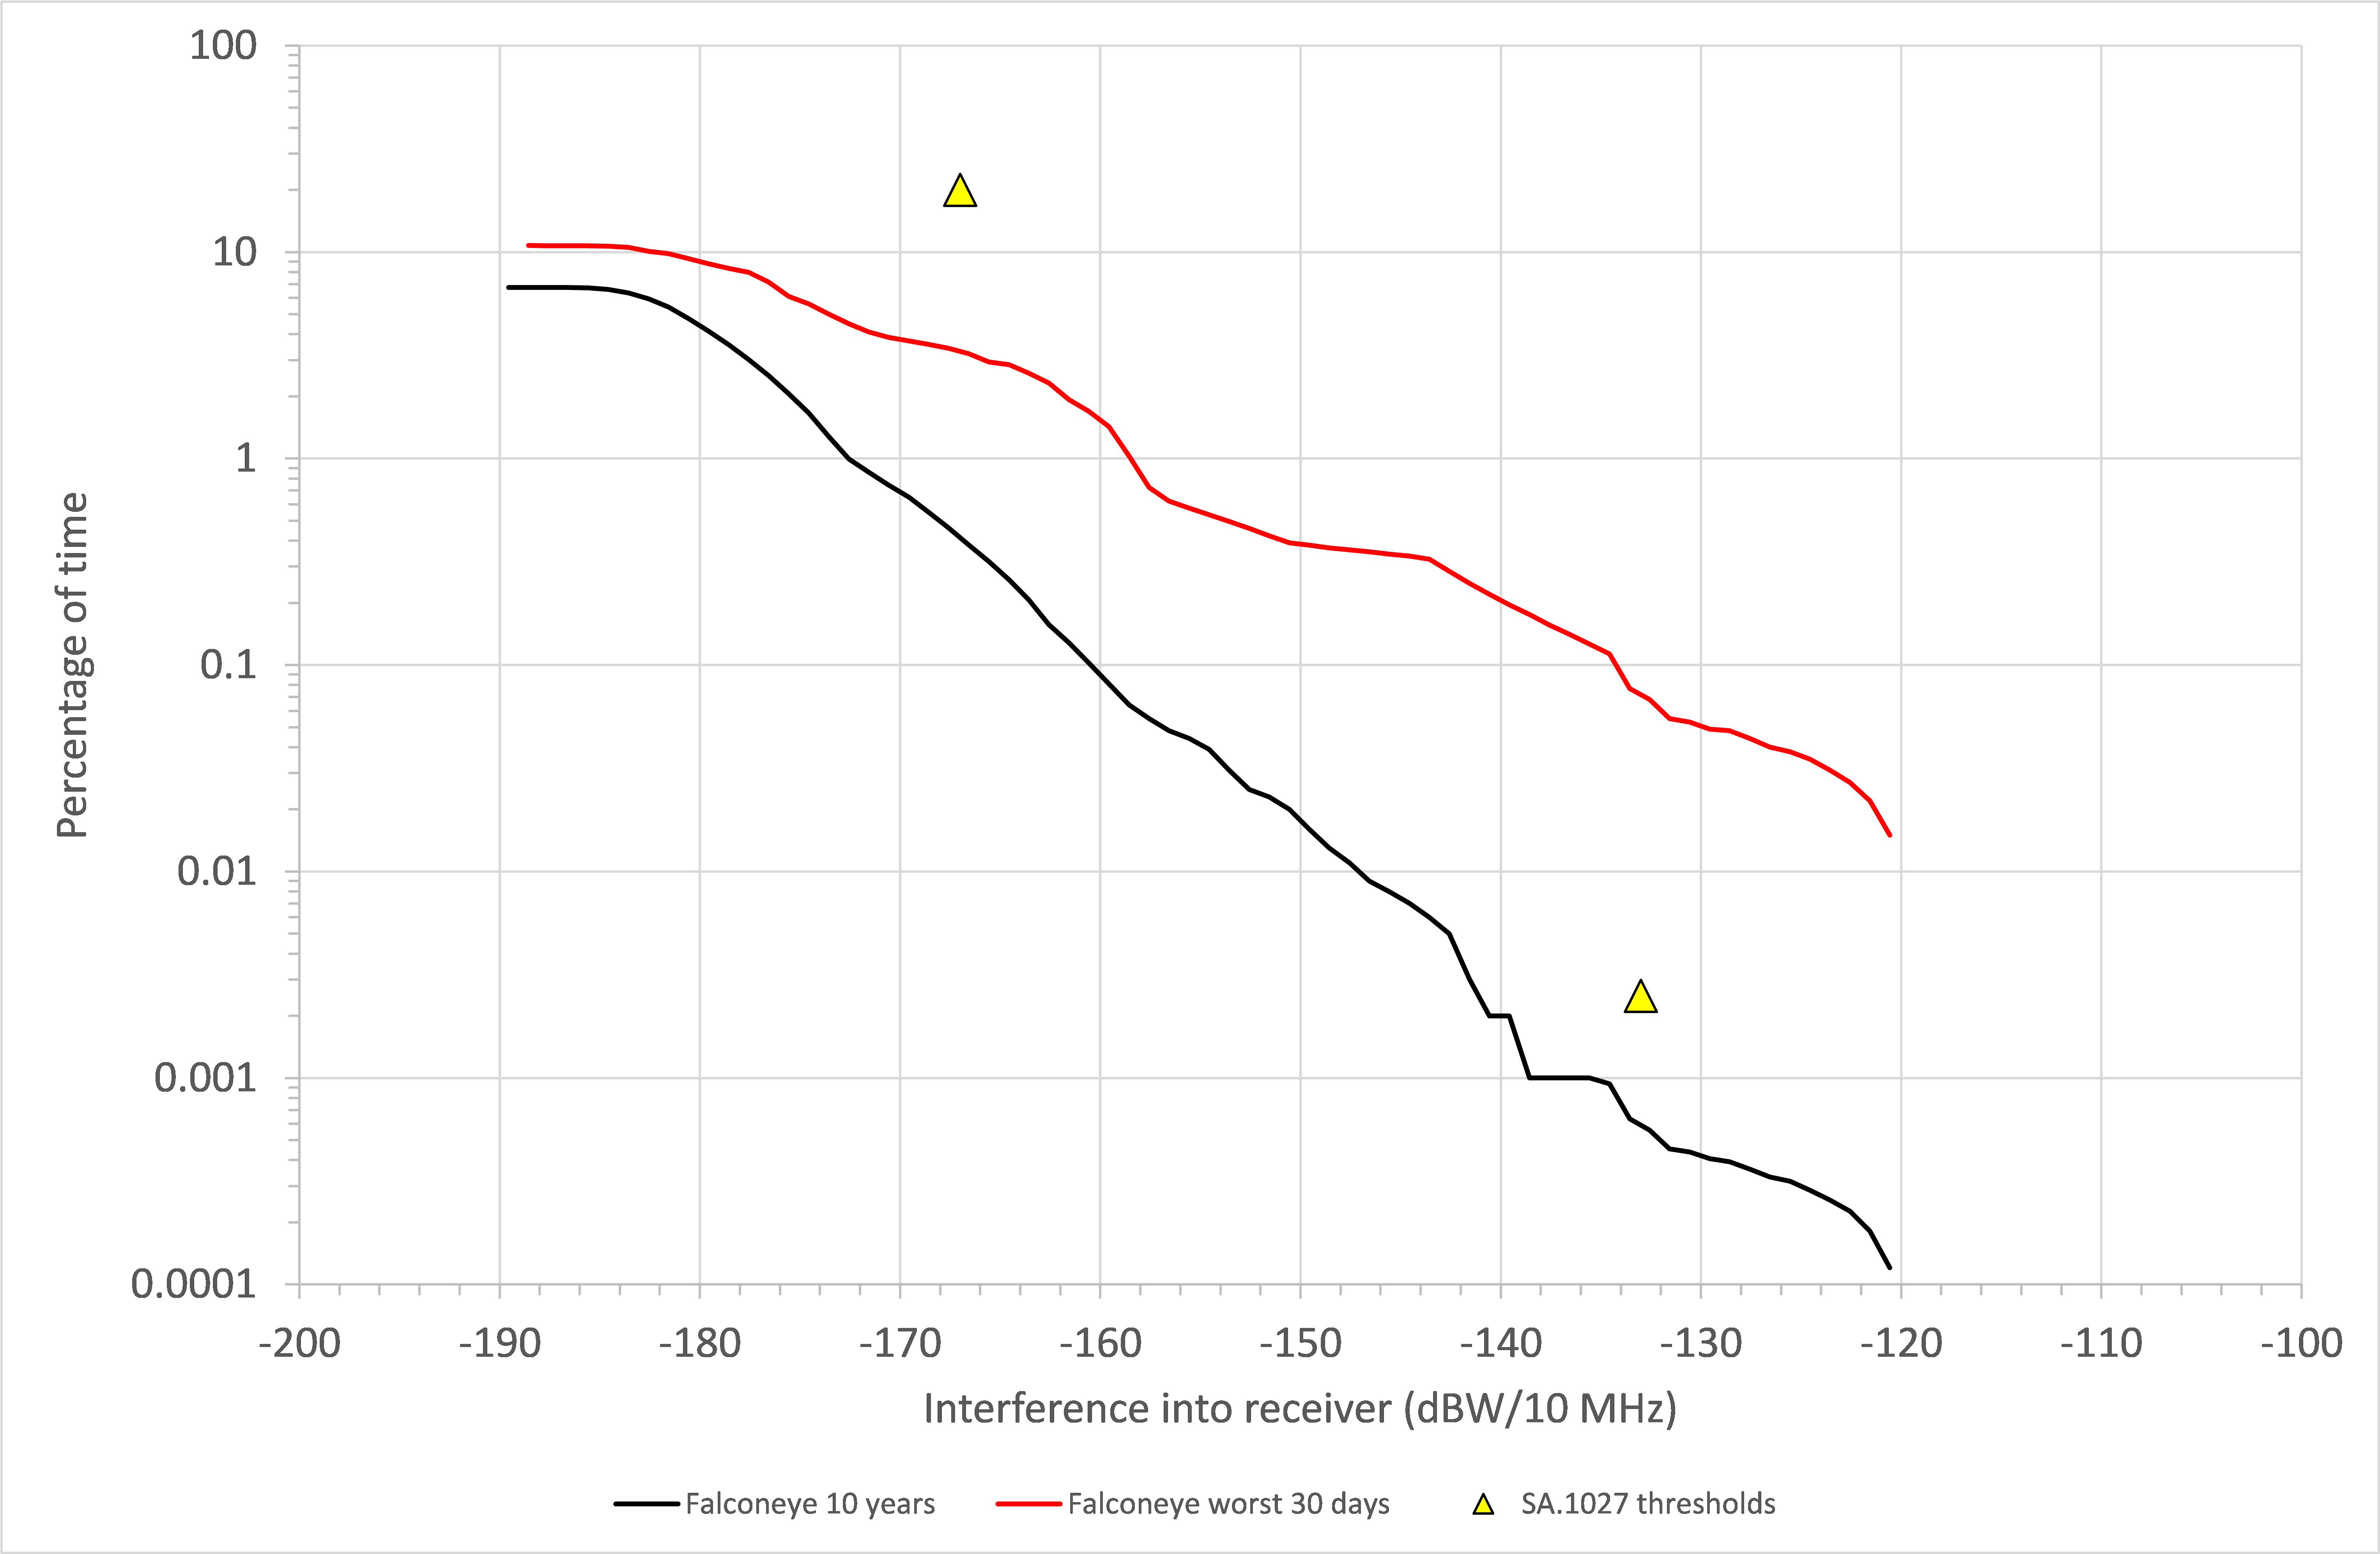
One run was undertaken over a simulation period of 10 years and the SA.1027 limits (shown as triangles) are met over this time scale.
However, sometimes orbits can be synchronised, in particular Sun synchronised orbits, which aim to have orbit elements selected so that the orbit drifts at a rate equal to the motion of the Earth around the sun, meaning the angle between the plane of the orbit and the vector to the sun is constant. This has benefits for Earth observation applications but if two satellite systems both use Sun synchronous orbits there can periods where the statistics are much higher.
The other run in the figure above considered the 30 day period around the time of the highest interference. It can be seen to exceed the SA.1027 limits.
It can therefore be important to consider:
- The time period for which statistics are being collected (all time vs. link active time)
- Any specific synchronisation effects between the two satellite networks.
It is also necessary to work out a suitable time step size. This can depend upon the beamwidth of the ES and satellite beams and also the height of the orbit. One way to calculate it is to determine the velocity of the satellite in circular orbit at height = as it passes overhead the ES:
Where =398600 and =6378.1. Then a suitable time step with samples in the main beam of size (in radians) can be estimated using:
Values of are typically in the range 5 to 16, based upon work in Recommendation ITU-R S. 1325 and S.1503.
Methods to Achieve Coordination
If interference analysis suggests there is no potential for harmful interference, the coordination can readily be achieved. However, if the study shows that the required thresholds are not met, then steps must be taken to reduce interference and hence achieve coordination.
A number of methods could be used to achieve coordination, including:
- Reduce transmit power: to reduce harmful interference into other systems, one method would be to reduce the wanted system’s transmit power. This might be feasible if link analysis (as in Link Design, Interference Margin and Thresholds) suggests that the required service could be provided at lower power.
- Improve antenna gain pattern: this could involve using larger antennas with narrower beamwidths, or using gain patterns with improved sidelobe performance, such as use of Recommendation ITU-R S.580 rather than that in Recommendation ITU-R S.465.
- Accept reductions in performance: if harmful interference into the wanted system only (say) occurs rarely, then the degradation in service might be acceptable. While not ideal, the key objective might be to achieve coordination and a slight degradation might not have a significant impact in the resulting service
- Geographic separation: in some cases, interference can occur if the ES of the wanted and interfering systems are too close together. This can be mitigated by locating the wanted ES further away from the interfering ES. This is particularly useful in cases where there are small numbers of ESs at known locations, such as gateways. It is less useful where there are large numbers of user terminals (UTs) at locations that cannot be controlled.
- Geographic diversity: a variation on geographic separation allows for use of co-located or nearby located ESs, but with the option to use another site if there is also inline geometry with the satellite(s) of each system
- Avoid pointing: the highest levels of interference typically occur when there is inline geometry, i.e. the line from the ES of one system to its satellite also points at the satellite of the other system. By switching off during these inline geometry cases, interference can be reduced to acceptable levels, though with momentary loss of service. This service loss can be mitigated using geographic diversity, as described above
- Orbit management: for Sun synchronous orbits, ensuring the orbits are not synchronized can assist in reducing interference, but at the cost of constraints on pass times of day
- Polarization: interference can be reduced if each system is using a different polarization, for example, one might be circular and the other linear
- Frequency separation: ultimately, systems can avoid harmful interference by operating on different frequencies, though this can result in reduced service and require coordination on these other frequencies.
As an example, the 30 days period worst interference case was modified to use a 5° avoid pointing method, which reduced the interference as follows:
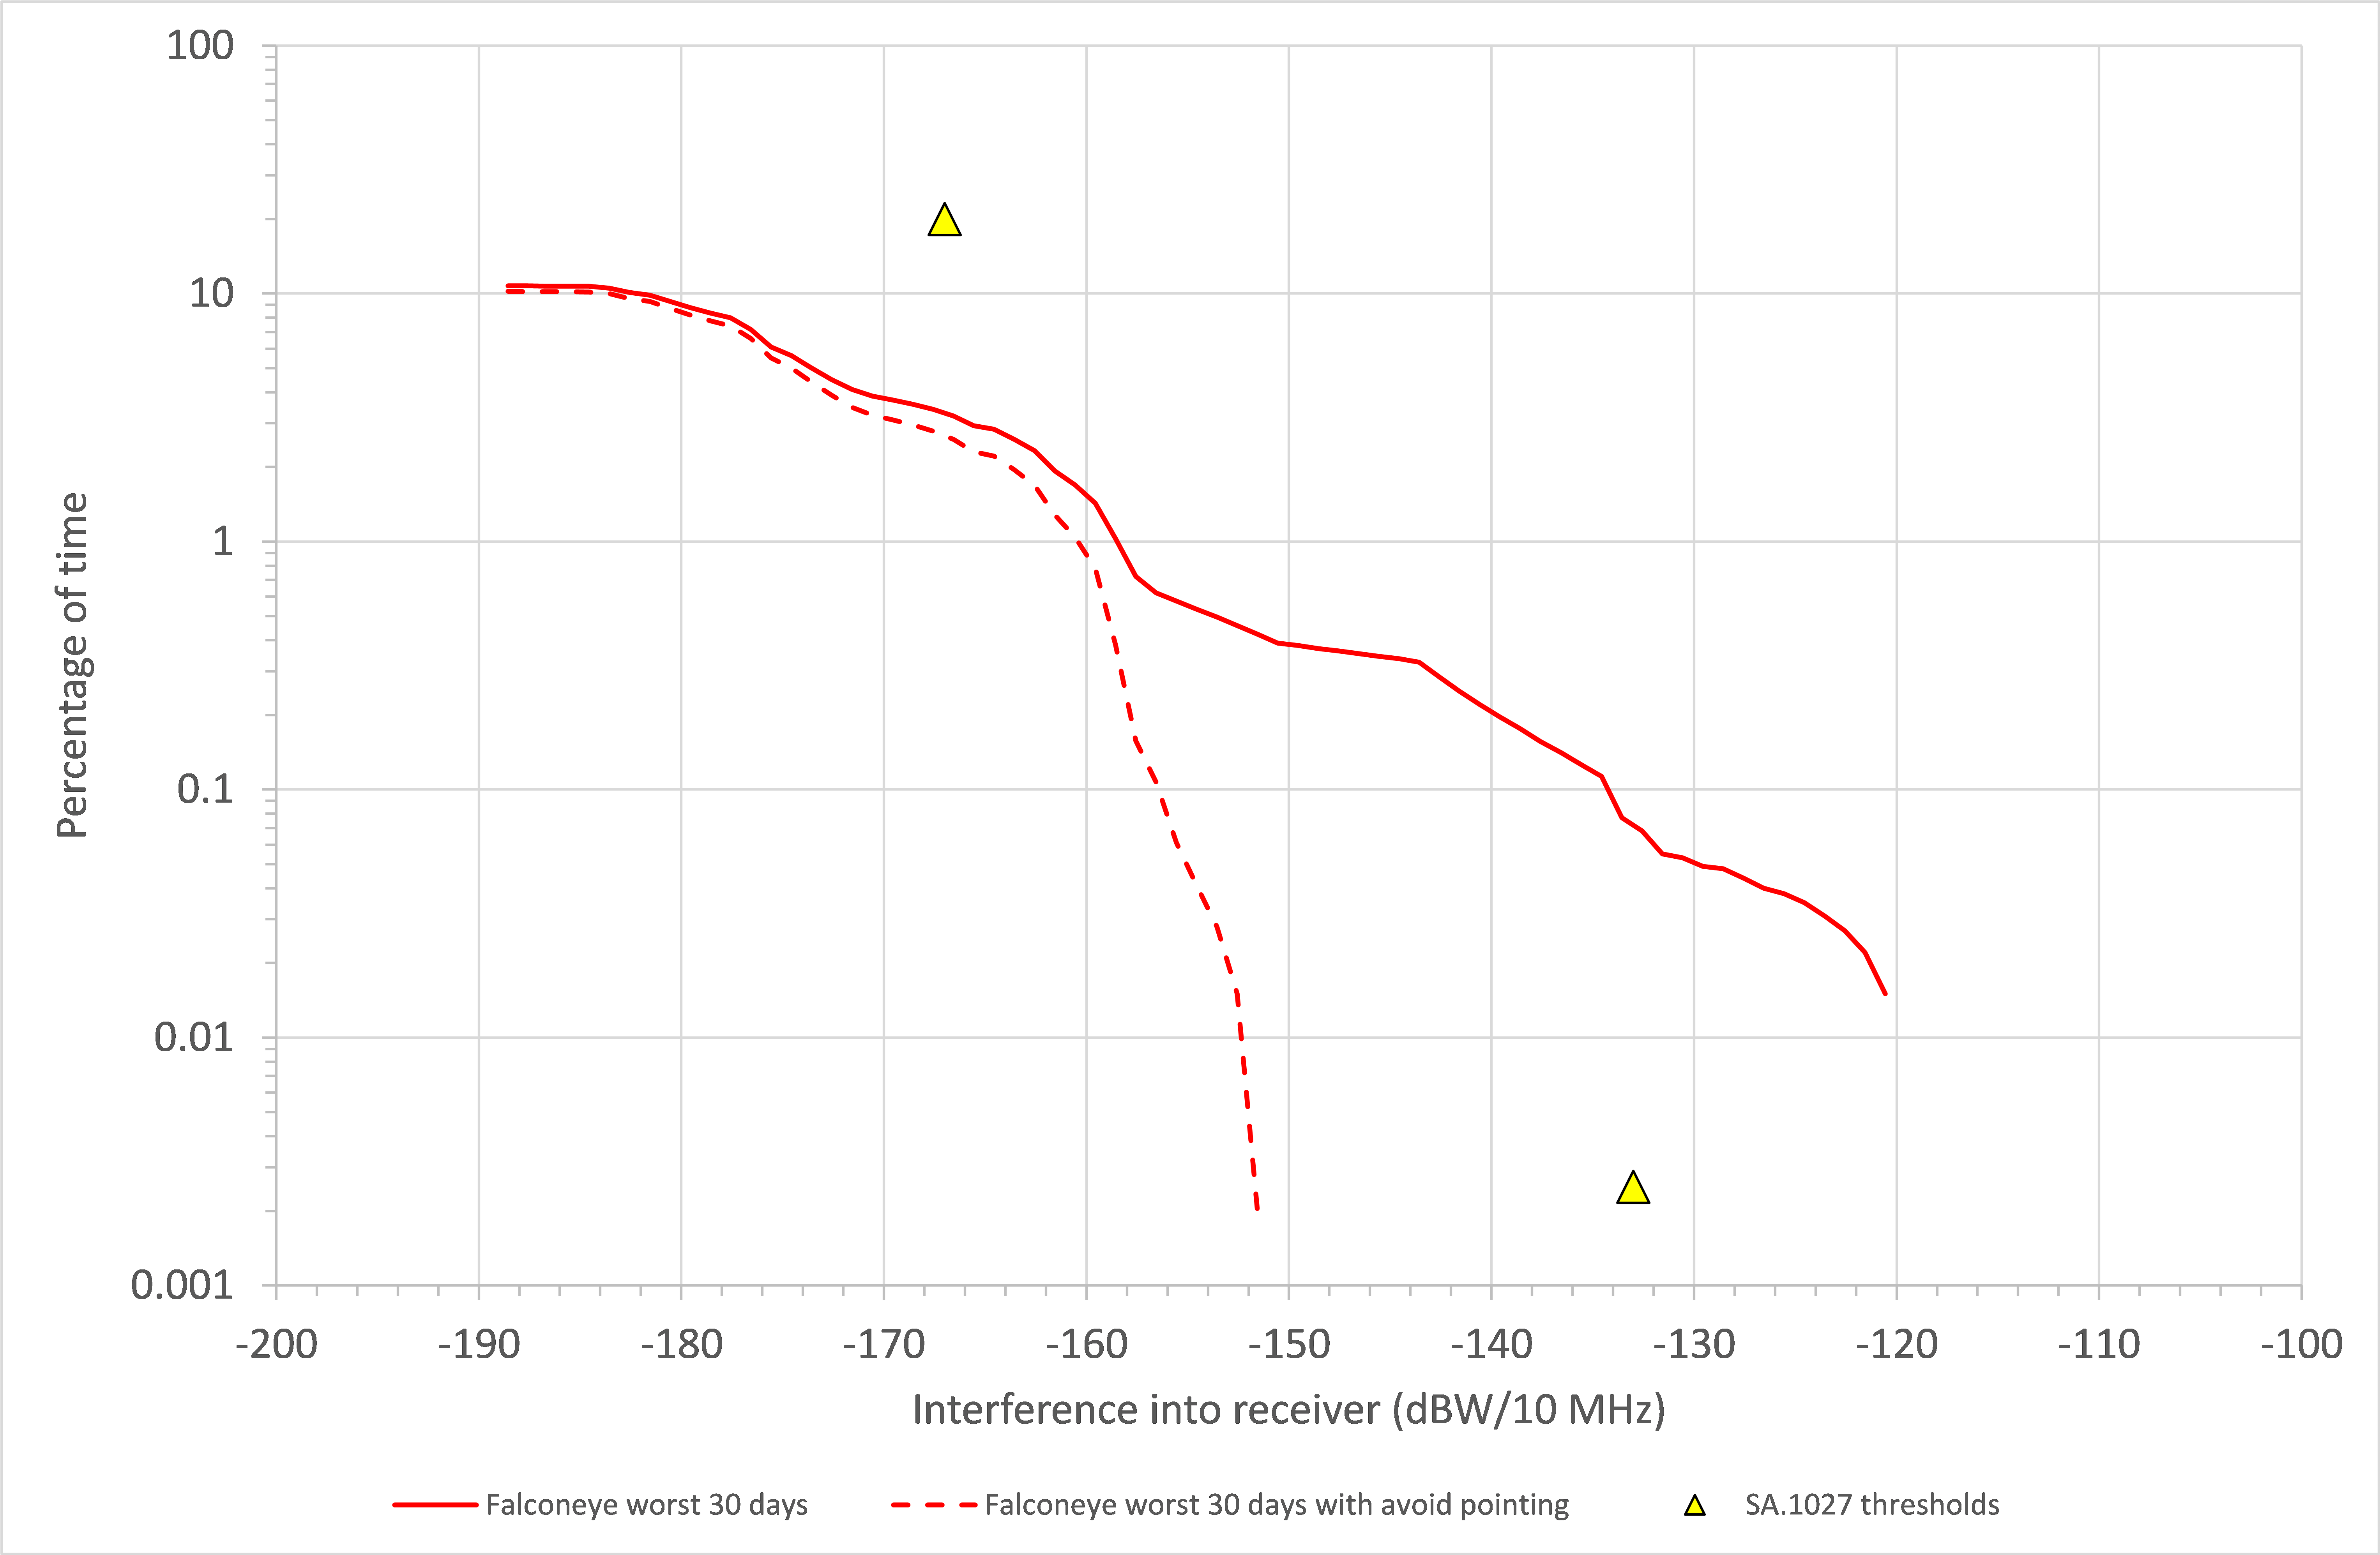
It can be seen that 5° is sufficient to meet the SA.1027 limits – indeed it is likely that a smaller avoid pointing angle could be used.
Large Constellation Coordination
Large constellations have similar principles but could have additional aspects to consider, including:
- In bands shared with GSO systems, the satellite selection is likely to include a GSO arc avoidance
- There could be very different types of ESs in user services bands to gateways
- It is necessary to consider aggregation of interference from many links
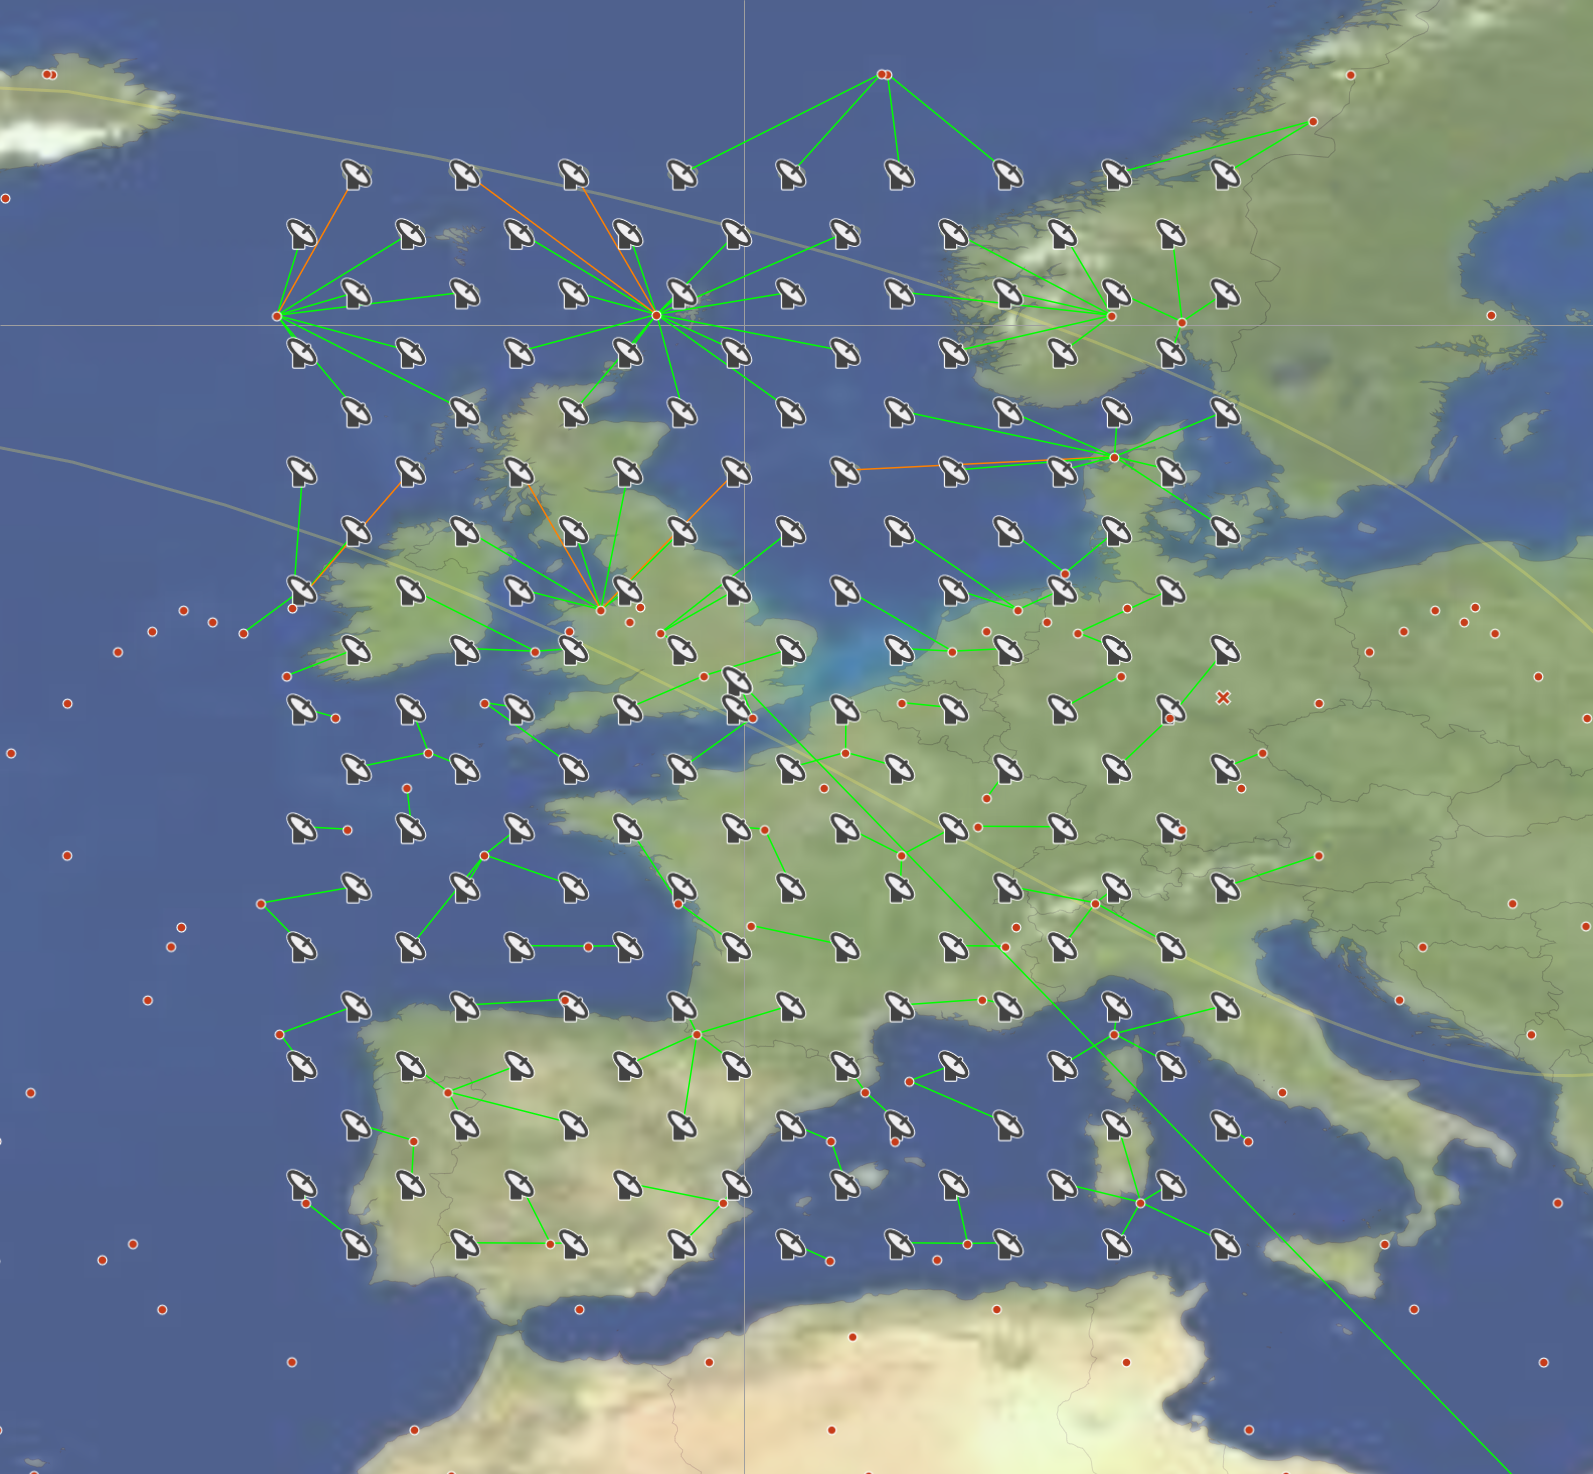
- In service links bands this aggregation can be modelled by an array of user terminals (UT) spaced according to frequency re-use distances (e.g. those provided for EPFD analysis) (see figure below, left)
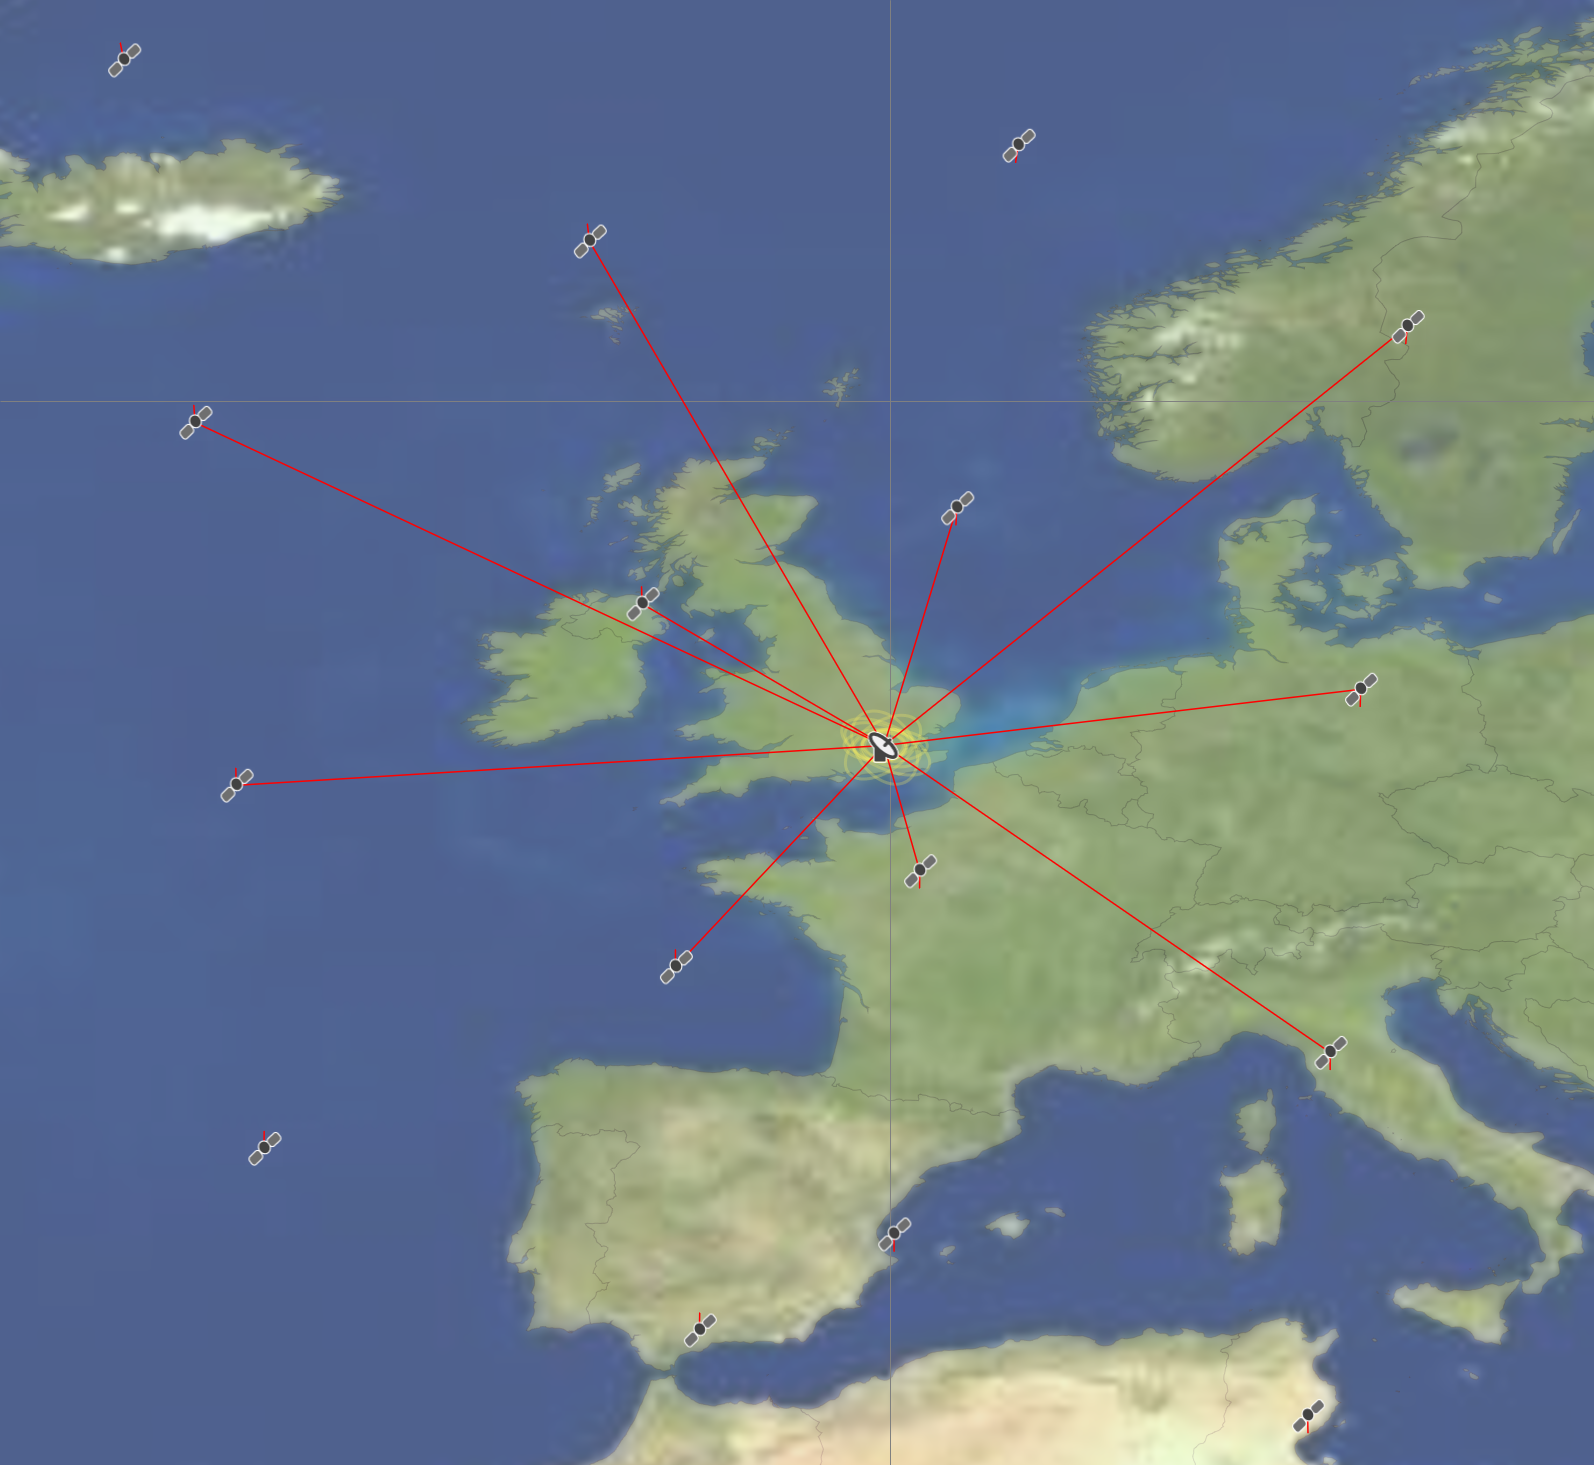
- In feeder links bands, this aggregation can be modelled by the gateway tracking a large number of satellites (see figure below, right)
- It is necessary to model the satellite’s antenna pointing method, which can be complicated and requires additional information to that in ITU filings (e.g. from FCC Technical Narratives)
- It is necessary to consider the frequency re-use scheme, even though the modelling might be done on a single frequency
- It can be helpful to consider traffic types and locations
- It is not feasible to ensure geographic separation for service links from UTs, so it can be necessary to rely on avoid pointing or other methods to mitigate harmful interference
- It can be more useful to consider metrics such as unavailability increase and loss of throughput which can be calculated using the equations in Recommendation ITU-R S.2131
- In higher frequency bands, in particular Ka and Q/V bands, it is important to model rain fading accurately, using the model in Recommendation ITU-R P.618 and including correlation of propagation fade percentage of time for co-located ESs in the downlink direction.
A good example of the type of analysis that could be required between non-GSO satellite constellations is provided in this document:
The screenshot below shows a simulation file created in Visualyse Professional based on the analysis method in this paper.
This shows there could be high levels of interference, with I/Ns of around +20 dB. In most cases, this can be mitigated by use of avoid pointing satellite selection methods.
EPFD Analysis
In some of the bands shared with GSO satellite networks, there are EPFD limits in Article 22 that a non-GSO system must meet to receive a favourable finding. The ITU will examine the filing databases submitted by the non-GSO operator using software that implements the algorithm in Recommendation ITU-R S.1503 and determine whether the EPFD calculated using the software meets or exceeds the validation EPFD limits.
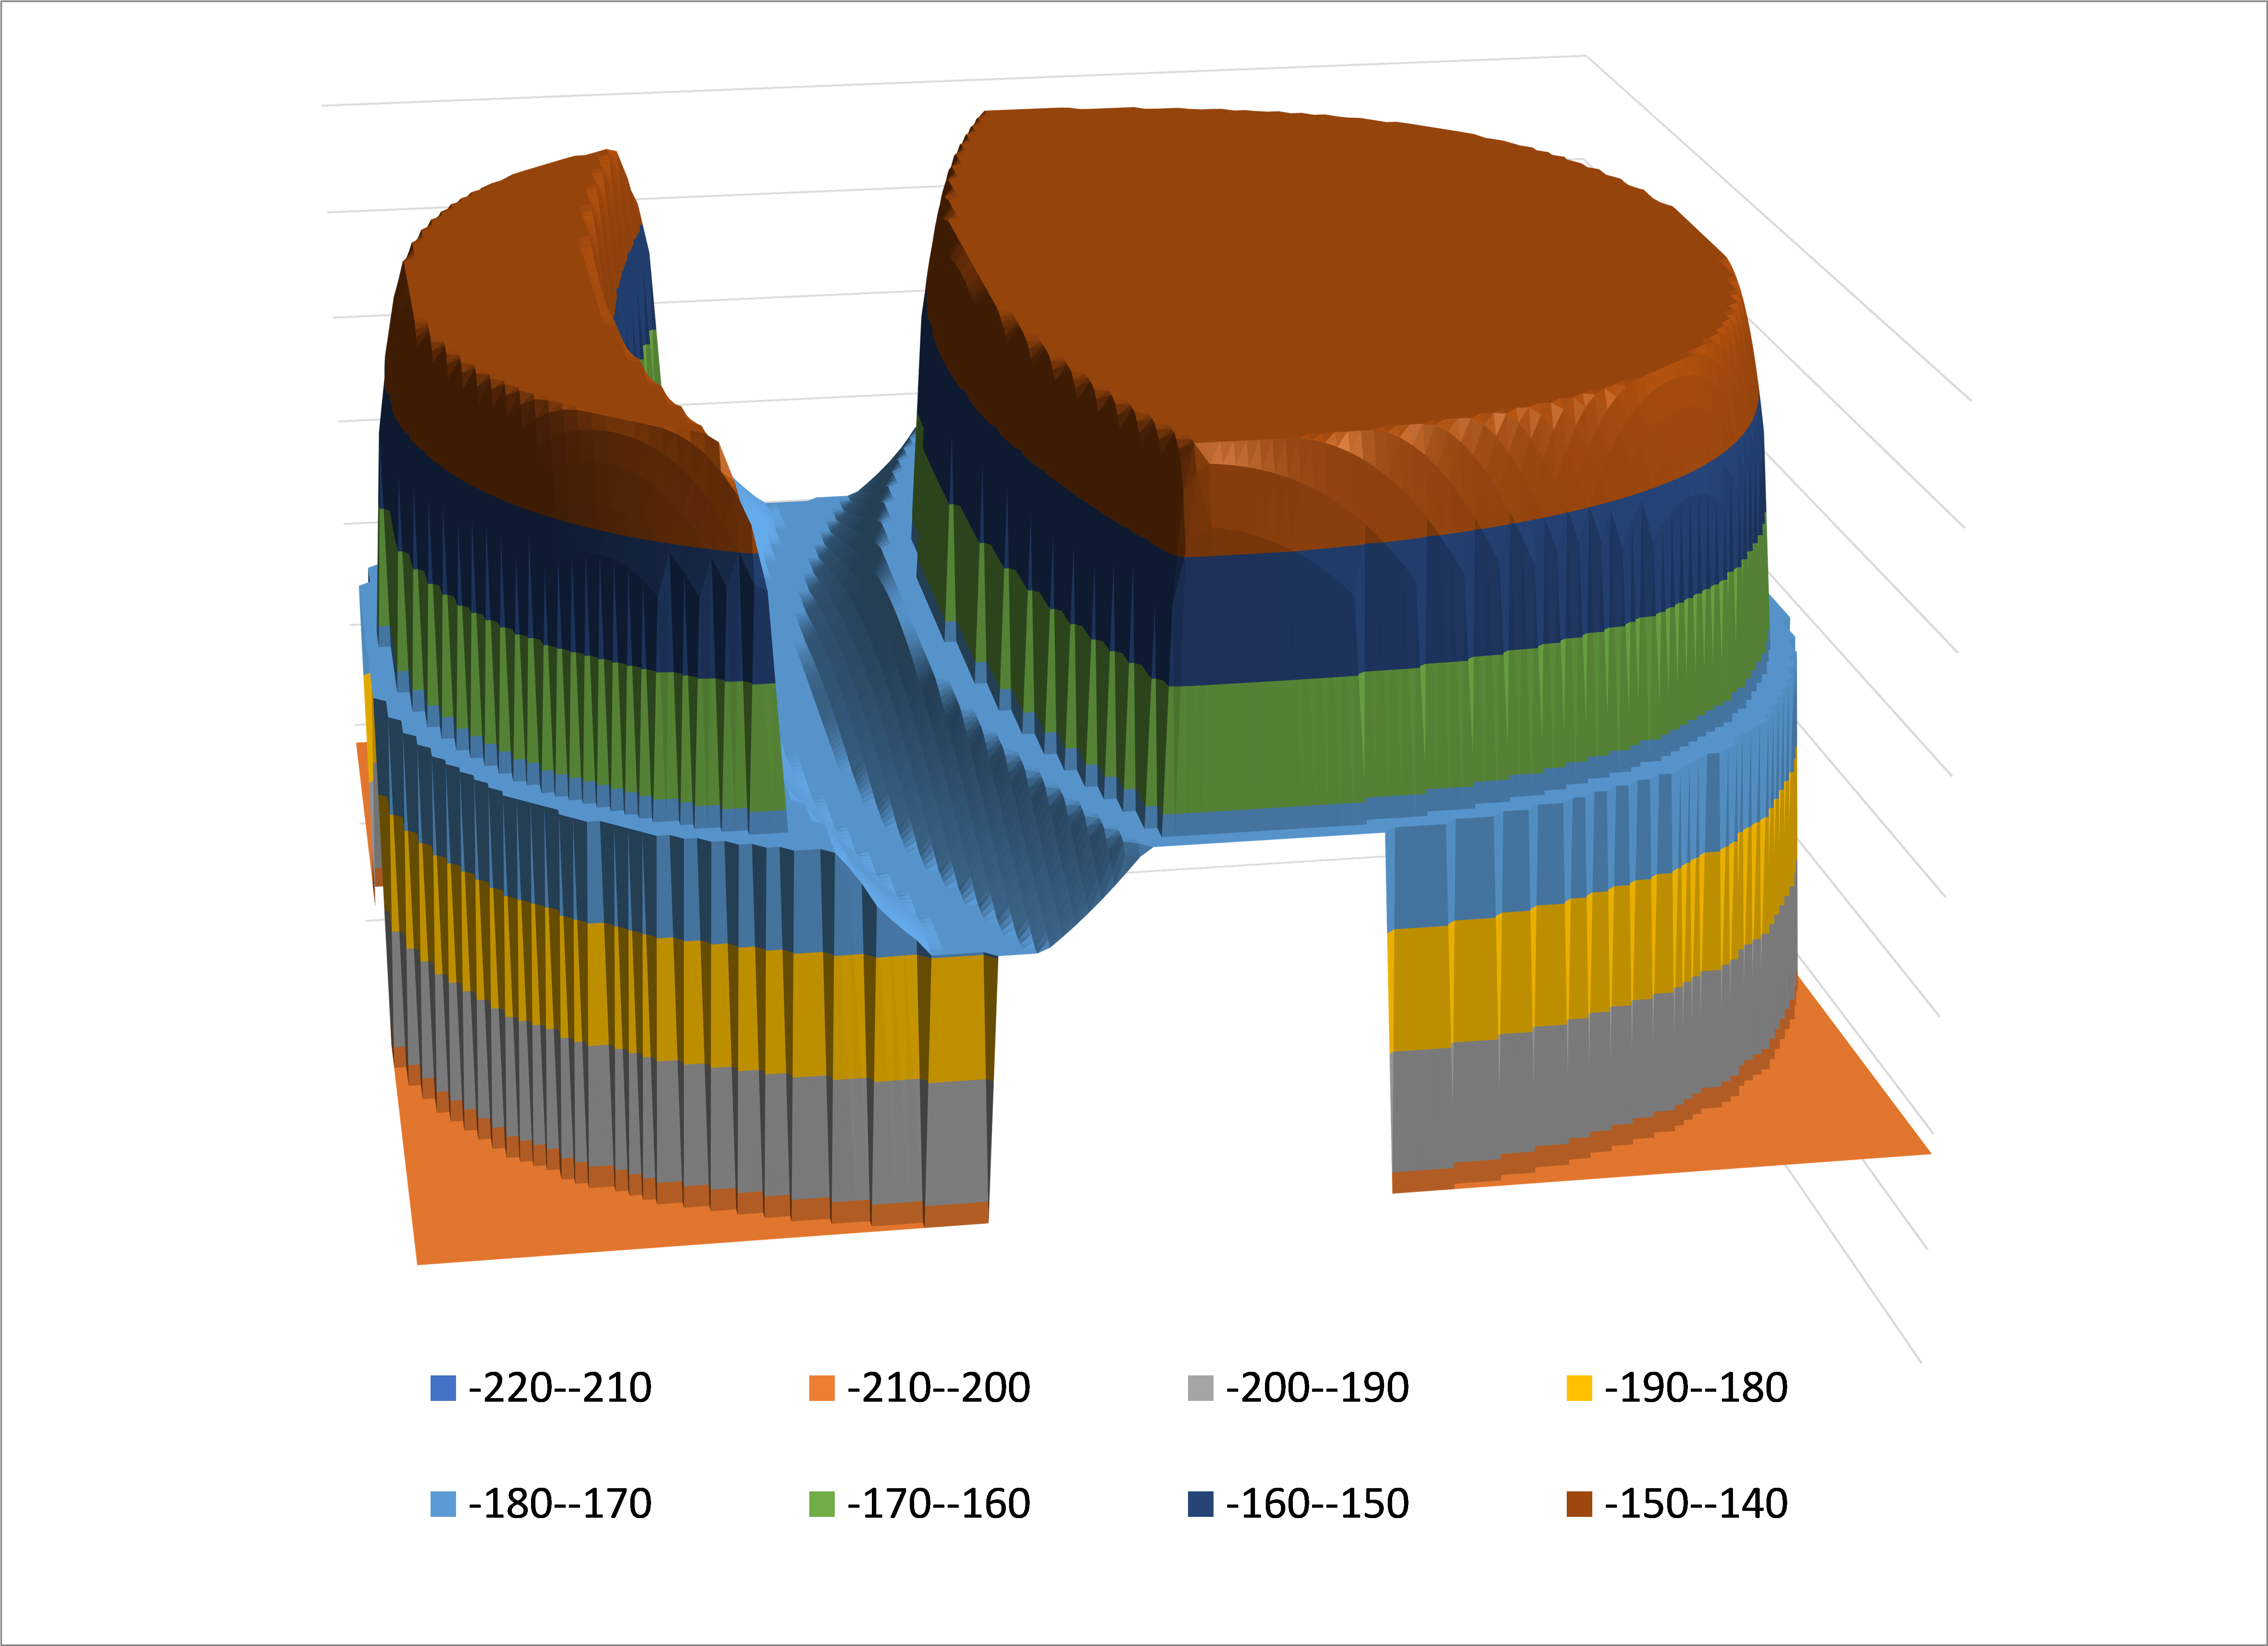
This analysis uses additional parameters in the filing, such as the satellite PFD masks. This is defined on the surface of the Earth in the satellite coordinate frame, typically something like PFD(satellite azimuth, satellite elevation). These tables of PFD can vary by latitude and in 3D look something like this:
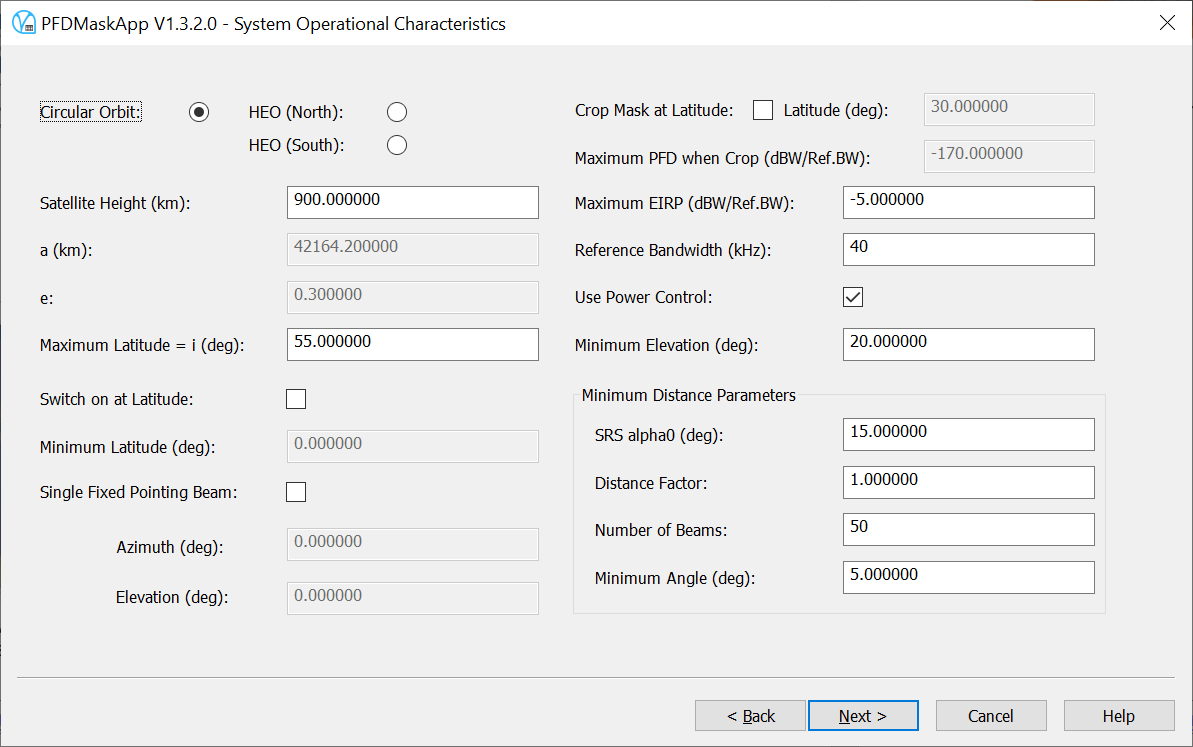
These PFD masks are complex to generate and to optimise, but tools can help, such as Transfinite’s Visualyse PMGT (PFD Mask Generator Tool):
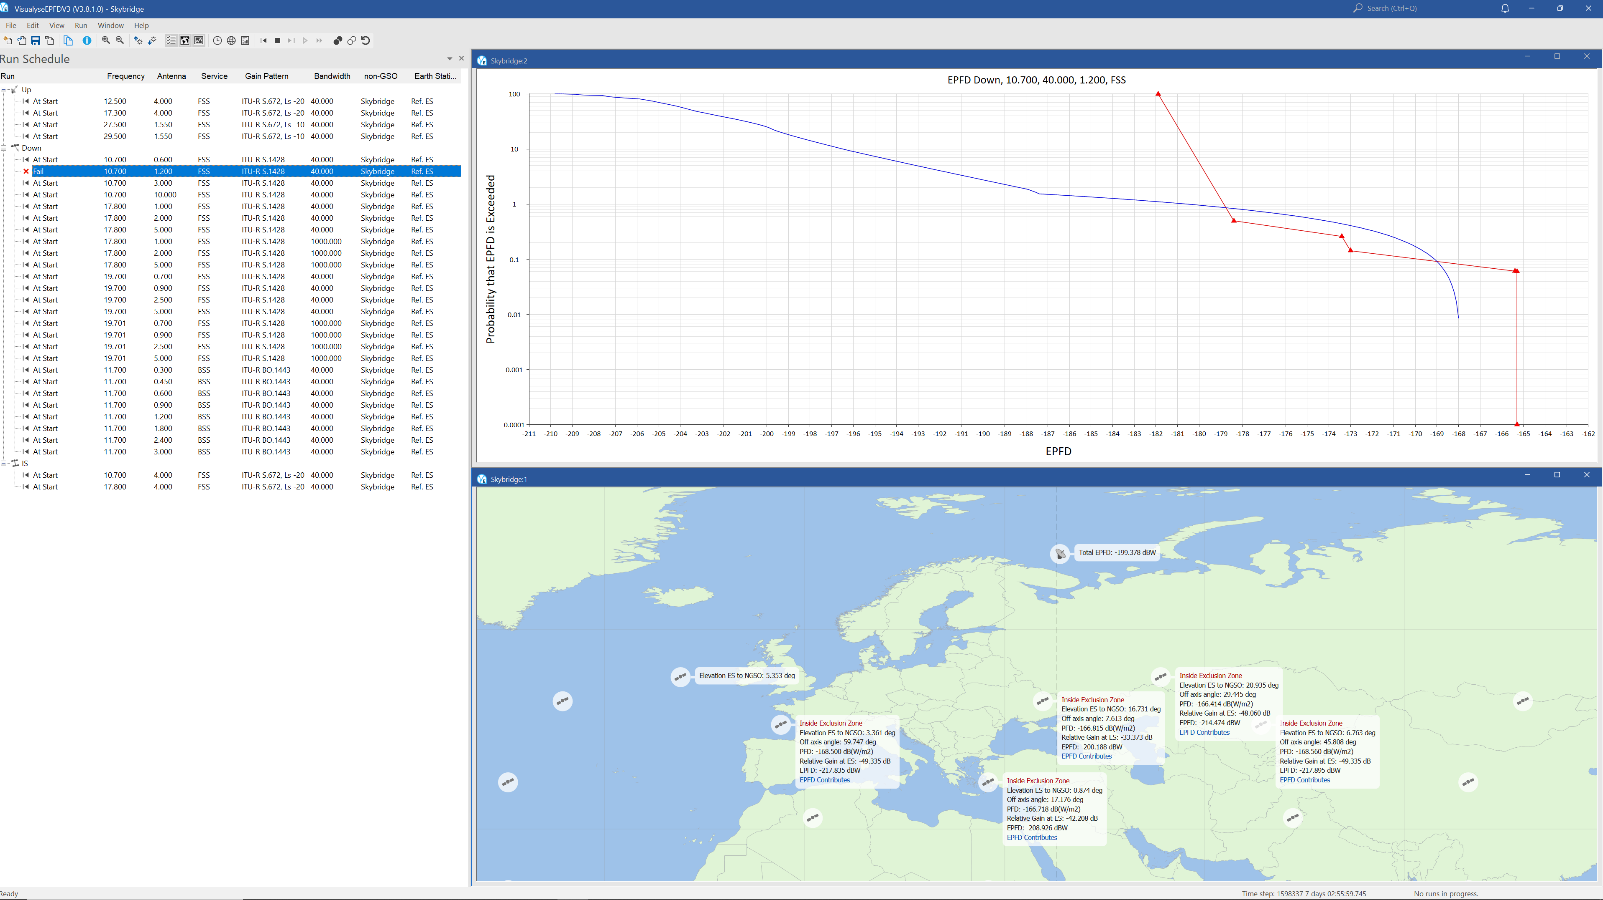
This tool can be combined with the Visualyse EPFD product (shown below) to undertake a sophisticated optimisation of the mask and other aspects of the filing to maximise the capacity of the non-GSO system while ensuring the EPFD limits are met.
With this suite of tools, a non-GSO operator can get a favourable finding and achieve their regulatory objectives, including coordination.