
6
Aug
Abstract
Visualyse Professional and Visualyse Interplanetary have recently been updated with a set of power flux density (PFD) related features, including the ability to define PFD masks by alpha angle as well as elevation, and also analyse the PFD or equivalent power flux density (EPFD) generated by a constellation by elevation and alpha angle, as described in this Technical Note.
What are PFD and EPFD?
The PFD is the power emitted by a radiocommunication system as measured at a reference location. The radiocommunication could be a satellite or terrestrial system and the measurement location could also be on the Earth's surface or in space. Examples of the use of PFD for terrestrial systems include definition of a PFD threshold for mobile base stations in parts of C band in 5.430A, which states that:
Before an administration brings into use a (base or mobile) station of the mobile service in this frequency band, it shall ensure that the power flux-density (pfd) produced at 3 m above ground does not exceed -154.5 dB(W/(m2 . 4 kHz)) for more than 20% of time at the border of the territory of any other administration.
This Technical Note will focus on the use of PFD and EPFD for satellite systems as measured on the surface of the Earth. This is of particular importance in the regulation of non-geostationary orbit (non-GSO) satellite systems with key thresholds the PFD limits in Article 21 and the EPFD limits in Article 22. Both PFD and EPFD are used in the regulation of radio navigation satellite systems (RNSS) under Resolution 609.
The definition of PFD is as follows:
This equation calculates the radio signal power going through a square metre of space at distance from the transmitter. It is a sum over all transmitting beams at a satellite, hence the summation from . The transmit power of the -th beam is and the gain towards the test point is .
Within Article 21 there are PFD limits to protect terrestrial services. As these typically provide a service at low elevation angles (e.g. fixed links and base stations which point close to the horizon), these limits are dependent upon the elevation angle = . An example would be these limits in Article 21 for the frequency range 10.7 - 11.7 GHz:
| Elevation angle (deg) | 0 - 5 | 5 - 25 | 25 - 90 |
|---|---|---|---|
| PFD (dBW/m^2/MHz) | -126 | -126 +0.5( - 5) | -116 |
Article 22 includes measures to protect geostationary orbit (GSO) satellite networks from harmful interference from non-GSO satellite systems. In this case, there is a big difference in terms of impact on the GSO link between:
- PFD of -130 dBW/m^2/MHz received in the direction of the main beam of the GSO earth station (ES)
- PFD of -130 dBW/m^2/MHz received in the sidelobes of the GSO ES
Hence the measure of interference used in sharing between non-GSO systems and GSO networks is EPFD, defined as:
The EPFD is therefore the PFD multiplied (in the linear domain) by the relative gain at the receiver , in this case the GSO ES.
As the non-GSO satellite moves, including at times within the GSO ES main beam, the EPFD(down) thresholds in Article 22 are not 100% of time limits but are given for percentages of time, as in the table below for GSO FSS in selected frequency bands in the range 10.7 – 12.75 GHz:
| EPFD(down) (dBW/m^2/40 kHz) | Percentage of time for which EPFD(down) may not be exceeded (%) |
|---|---|
| -175.4 | 0 |
| -174 | 90 |
| -170.8 | 99 |
| -165.3 | 99.73 |
| -160.4 | 99.991 |
| -160 | 99.997 |
| -160 | 100 |
As a key factor in the EPFD equation is the receiver relative gain, this must be defined, and for this case it is the one in Recommendation ITU-R S.1428 for dish of size 60 cm.
What Types of Study Are there involving PFD and EPFD?
There are a wide range of studies that could use PFD and EPFD. For example, analysis could consider the following scenarios:
- Analyse the impact of all satellites in a constellation on terrestrial fixed service (FS) links in terms of the I/N at the FS receive station by modelling the emissions from the non-GSO satellites via a PFD mask of the form PFD vs elevation angle
- Analyse the impact of all satellites in a constellation on a GSO satellite network in terms of the EPFD at the GSO ES by modelling the emissions from the non-GSO satellites via a PFD mask of the form PFD vs alpha angle
- Analyse the impact of all satellites in a constellation of RNSS satellites on an aeronautical radionavigation service (ARNS) in terms of the EPFD at an ARNS receiver by modelling the emissions from the RNSS satellites using a PFD mask of the form PFD vs elevation angle
- Determine how the maximum PFD emitted by each satellite of a constellation of non-GSO satellites varies by elevation angle and whether it meets the PFD limits in Article 21, using detailed beam-by-beam modelling of the constellation
- Determine how the EPFD emitted by each satellite of a constellation of non-GSO satellites varies over time and whether the resulting cumulative distribution function (CDF) meets the EPFD limits in Article 22, using detailed beam-by-beam modelling of the constellation
- Determine how the maximum PFD emitted by each satellite of a RNSS constellation varies by elevation angle using detailed beam-by-beam modelling of the constellation
- Analyse the impact of all satellites in a constellation on terrestrial fixed service (FS) links in terms of the I/N at the FS receive station using detailed beam-by-beam modelling of the constellation
- Analyse the impact of all satellites in a constellation on a GSO satellite network in terms of the EPFD at the GSO ES using detailed beam-by-beam modelling of the constellation
It can be seen that there are three types of modelling:
- Analyse the impact on a victim receiver assuming the satellite systems is using a PFD mask
- Determining if a PFD mask is met using detailed beam-by-beam modelling of the satellite system
- Analyse the impact on a victim receiver assuming the satellite systems using detailed beam-by-beam modelling of the satellite system
These types of modelling require different components within the Visualyse Professional and Visualyse Interplanetary tools (generally described here as Visualyse), as described below.
Definition of PFD Masks
Visualyse allows emissions from satellite systems to be defined by via a special type of Antenna Type, namely the PFD Mask Antenna Type, as shown in the figure below.
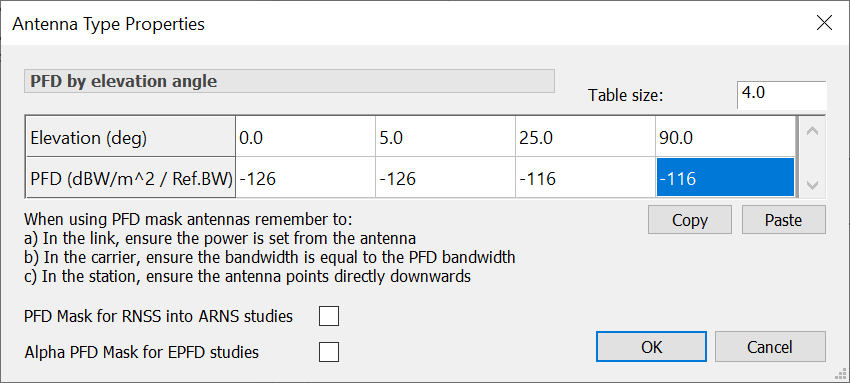
The PFD mask by default is defined as PFD vs elevation angle on the surface of the Earth, hence the range is from 0° to 90°.
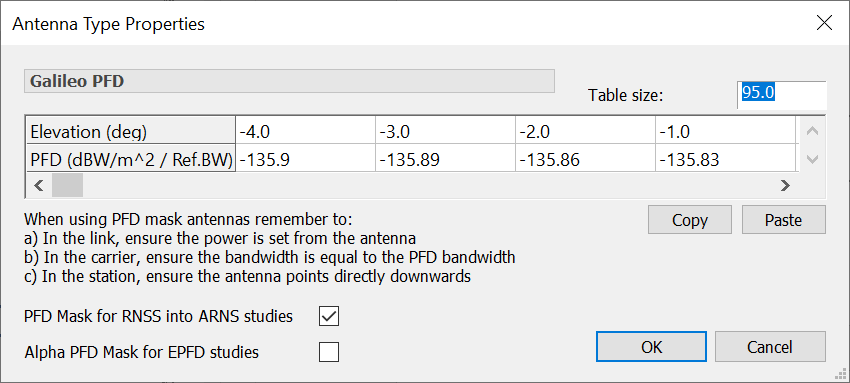
Analysis for RNSS studies is into an ARNS receiver at a height of 12.192 km and hence the elevation can be negative. An option is therefore available to select “PFD Mask for RNSS into ARNS studies” that allows negative elevation angles, as in this example:
For analysis of sharing between non-GSO systems and GSO networks, a key algorithm is the one in Recommendation ITU-R S.1503. This defines the emissions of the non-GSO satellite using a PFD mask, and one of the forms uses PFD(alpha) where alpha is the minimum angle at the GSO ES between the line to the non-GSO satellite and any point on the visible part of the GSO arc.
An example of the PFD mask in alpha format is shown below:
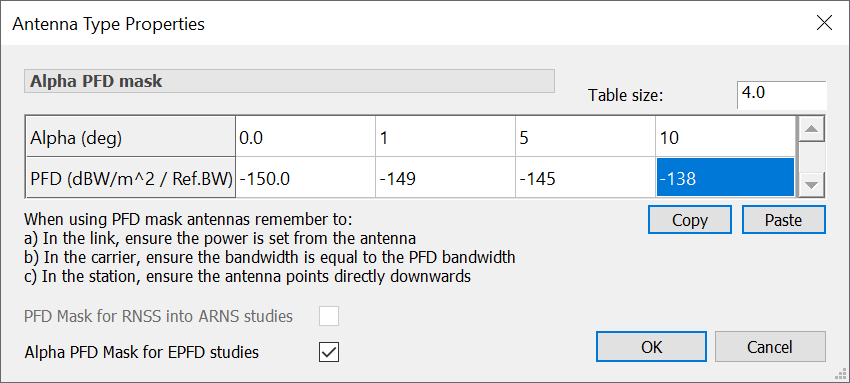
Note that this PFD mask is applied to all satellites of the constellation and alpha is assumed to be positive i.e. negative alpha angles are not used in the calculation.
These PFD masks can then be activated in a number of ways, including:
- Transmit Link: this is the simplest approach, activating all satellites in a Station Group, such as one created using the Constellation Wizard
- Dynamic Link: whereas the Transmit Link simply switches all satellites on, a Dynamic Link allows more control, including use of Tracking Strategies to select active satellites by (say) elevation angle and angle to the GSO arc. But it requires one or more non-GSO ES to select which satellites are active
In both cases, the transmit power should be defined as from the Antenna Type and the reference bandwidth for the PFD mask used as the Carrier bandwidth.
Detailed Beam-by-beam Modelling of non-GSO Systems
In comparison to modelling emissions of a non-GSO satellite systems using PFD masks, an alternative is to model in detail at the beam level. Typically, this requires:
- One or more non-GSO ES to drive the traffic to the constellation. It can be useful to create a grid of non-GSO ES using the Service Area Wizard. It can also be useful to consider the relative geometry between the non-GSO ES and any victim station (terrestrial or GSO ES) – for example, to consider high or low elevation, co-located, inline or separated geometry etc
- Constellation of non-GSO satellites, typically created using the Constellation Wizard
- Set of Dynamic Links, one per non-GSO ES, to active emissions from the constellation. Usually, the start Station is the ES and the end Station is selected from the non-GSO constellation, so that the end to start direction is the downlink
- At least one Tracking Strategy, to determine which non-GSO satellite should be used at each time step by each of the non-GSO ES
An example is shown below of a beam-by-beam model of the Starlink constellation using parameters from the FCC Applications:
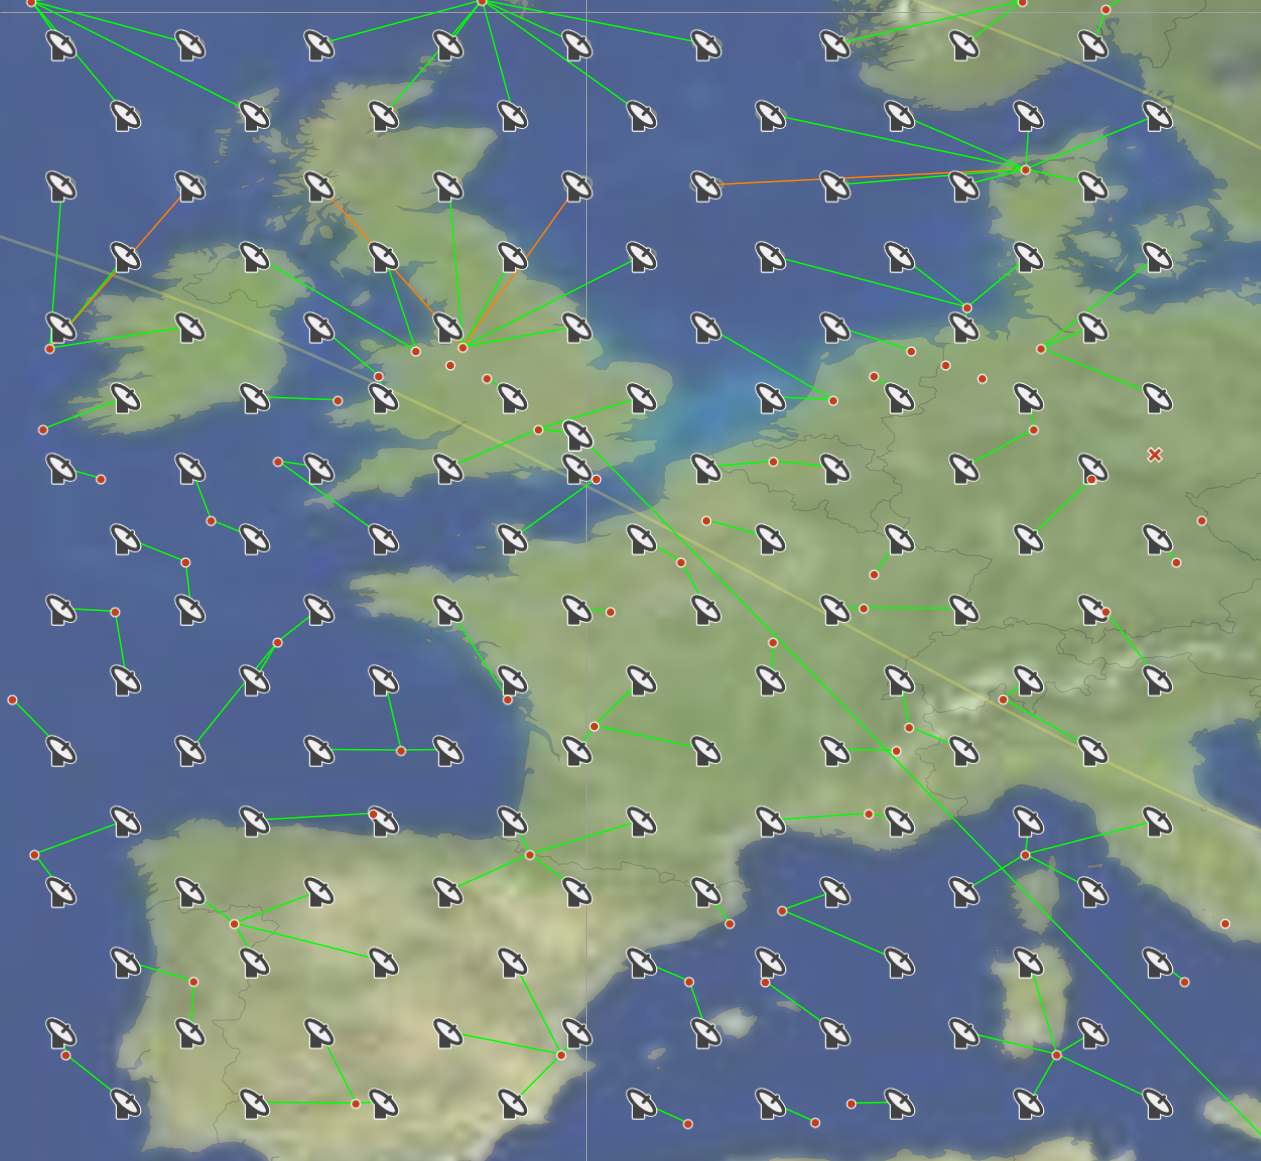
This beam-by-beam simulation can also include detailed modelling feature such as power control, electronically steered beams, adaptive gain patterns, traffic variation, propagation effects including rain, etc.
Metrics that can be calculated using such a detailed simulation include I, I/N, C/N, C/(N+I), PFD / EPFD and associated metrics like throughput and availability / unavailability.
Calculating PFD From a Detailed Simulation
As noted above, one of the key questions is to determine the satellite PFD, either to compare against the Article 21 limits or, for an RNSS system, to use Resolution 609 study.
The key is use of the PFD object that is contained within any of the Links that have a Link Path, such as Fixed, Dynamic or Receiver. This calculates the PFD of the interferer (not wanted) systems as that allows the aggregation function in Visualyse to be used.
The PFD object and its attributes can be seen in a Watch Window as in this example:
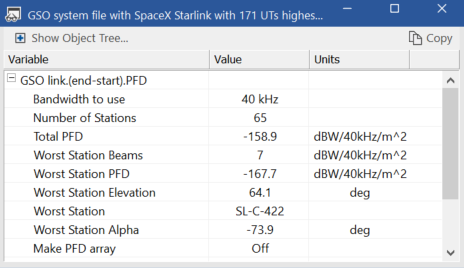
The PFD object shows:
- The bandwidth used
- Number of Stations considered
- The total PFD or EPFD over all Stations
- The number of Beams from the Station that had the highest PFD or EPFD
- The elevation angle of the Station that had the highest PFD or EPFD
- The name of the Station that had the highest PFD or EPFD
- The alpha angle of the Station that had the highest PFD or EPFD
For some analysis, e.g. of an RNSS satellite system, this information can be sufficient to generate the required output. The RNSS satellite could be flown over a test point and the PFD and elevation angle logged to file. This can then be used in a detailed Resolution 609 study to calculate the EPFD into an ARNS system. More information is available on modelling RNSS in the paper: RNSS Updates to Visualyse Tools
If there are many non-GSO satellites, each with different PFDs and elevation angles at each timestep, a different approach is required. In this case, it is necessary to activate the advanced PFD analysis functions, which are available under the “Statistics Calculation Options” dialog:
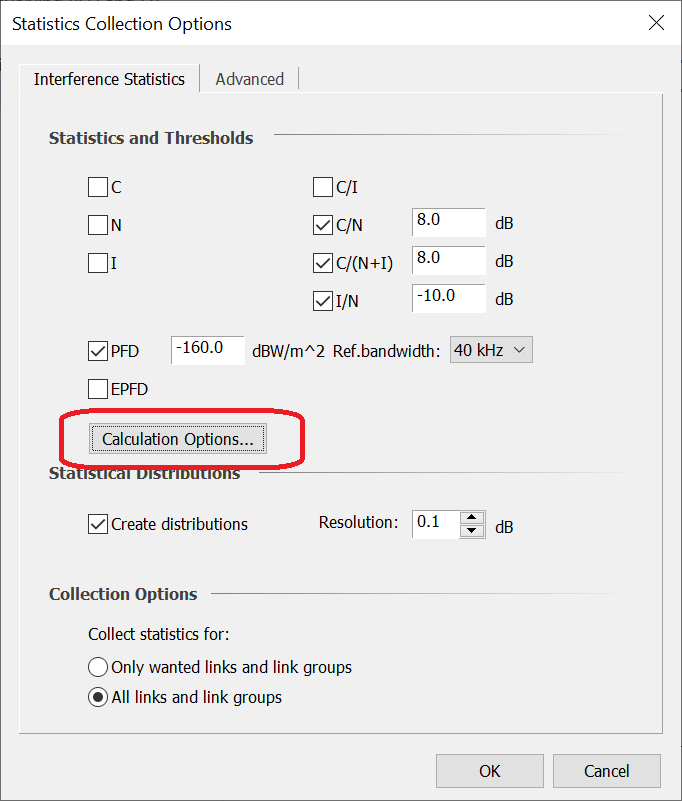
Having selected this option, the Watch Window shows additional information, as discussed in the following section.
PFD Analysis Functions
The Advanced PFD Analysis provides one or both of these arrays of information:
- Array of maximum or minimum PFD / EPFD per satellite by elevation angle or alpha angle. These angles can either be signed, so the angles are in the range -90° to +90° or in absolute range i.e. from 0° to 90°
- If the PFD per satellite array is in absolute range, then there is the option to create a histogram of number of time steps and satellites for each PFD / EPFD. The histogram uses ninety bins of size 1 dB from the bin minimum given. This histogram can be filtered so it only shows the PFD of those satellites which are in a specified range of elevation or alpha angle
These arrays are visible in the Watch window for the PFD object and can be copied into other applications such as Excel for post-processing and charting.
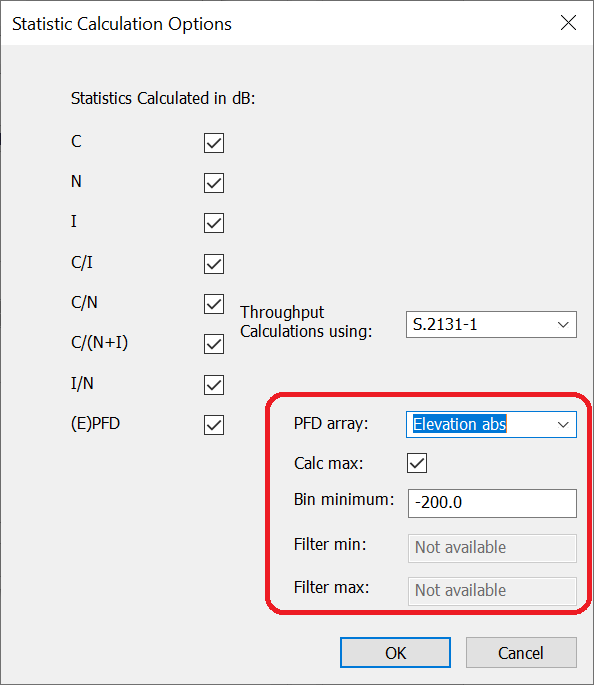
The dialog above has been configured to:
- “PFD Array = Elevation abs”: the tool will undertake PFD analysis by elevation angle, taking the absolute value of the elevation angle so that 0° <=
- “Calc max = enabled”: the analysis will take the highest PFD per satellite for each of the elevation angles considered
As the analysis is only interested in the absolute value of the elevation angle, there will also be a second histogram showing the histogram of PFDs. This has been configured using:
- “Bin minimum = -200”: the histogram of PFDs uses 1 dB bins starting at a minimum of -200 dBW/m^2
- “Filter min”: this is not used
- “Filter max”: this is not used
For the Starlink simulation file described earlier, this creates the output in the figure below in terms of maximum PFD vs. elevation angle after 10,000 samples.
Note that the simulation file was altered to randomise the position of the GSO ES within the range of the non-GSO ES. This allows a range of geometries and PFDs to be tested.

It can be seen that there are greater PFDs at higher elevation angles when the satellite is likely to be active. In this case the system was using power control to maintain a constant PFD over elevation angles for which the system could be providing a service, so the PFD is nearly constant for elevation angles above about 50°.
Note that the satellite selection method was highest elevation for satellites above 40° elevation, which typically means a satellite of at least 50° elevation.
The active satellite PFD was around -144 dBW/m^2/40 kHz, but note that this is the maximum: the question can be asked, how much variation is there in the PFD from satellites at high elevation angles? This question can be answered by creating a histogram of the PFD but filtering on those satellites that are above 50° elevation. An example output is shown in the figure below:

It can be seen that there is a large variation of PFD for these high elevation angles. This relates to there being spaces between non-GSO ES, as can be seen in the figure above. The test point is randomly located within the range of the non-GSO ES and so for some samples it will be between non-GSO ES. Therefore, there would be no non-GSO satellite beam pointing in that direction so that the PFD will be from sidelobes at the satellite and hence much lower.
Note that all the analysis above could be repeated using EPFD rather than PFD and use the alpha angle rather than elevation angle.