
2
Jul
Abstract
WRC-27 Agenda Item (AI) 1.6 is to consider technical and regulatory measures for Fixed Satellite Service (FSS) networks / systems in parts of Q/V band for equitable access. These studies are to consider both geostationary (GSO) networks and non-GSO systems to ensure that all countries have access to these orbits and frequency bands. This suggests use of a planning approach similar to that which was used in parts of C and Ku band for GSO networks. But is it feasible for large number of non-GSO systems to operate simultaneously at the same location? Are there constraints or limitations that would restrict the number that could operate or results in low spectrum efficiency? This Technical Note (TN) analyses the ability of medium Earth orbit (MEO) to provide access for multiple non-GSO networks.
Note that this TN is provided for the purpose of demonstrating the capability of Visualyse Professional simulation tool. All input parameters and results are for illustration only and do not reflect any actual system or proposal under this AI.
Introduction
WRC-27 AI 1.6 considers technical and regulatory measures for FSS satellite networks/systems in parts of Q/V band for equitable access. It notes that under the Radio Regulations, all countries have equal rights with respect to use both radio frequencies and GSO and non-GSO orbits. In many frequency bands, this access is based upon the "first-come, first-served" concept, with coordination under Article 9 used as a way to manage the potential for harmful interference. However, concerns have been raised as to whether this approach could be appropriate as it can "result in difficulties for future access to limited spectrum and orbits resources for later filed systems".
In some frequency bands, a regulatory framework has been developed that facilitates equitable access for GSO networks by a plan that ensures that all countries are assigned frequencies and a location on the GSO arc. This approach takes advantage of the GSO arc being readily divisible, with an average separation angle of 2° resulting in 180 available locations. GSO systems also can provide a usable service to a country with only a small number of satellites, potentially just one.
However, non-GSO satellite systems need a constellation of satellites to provide a continuous service, even at a single location, and some constellations can have many thousands of satellites. These non-GSO constellations must have mechanisms to support space traffic management, such as separation in height between planes of different constellations. For example, Resolution 8 gives distances in the range 70 to 100 km and if the latter separation was applied to low Earth orbit (LEO), between heights of 500 km and 2,000 km, this could result in the operation of just 16 systems .
So, how could it be feasible to create a regulatory framework that would permit large numbers of non-GSO systems to operate simultaneously and safely, able to provide a usable service without harmful interference? And how could studies be done to analyse the ability of various combinations of non-GSO constellations to operate, taking into account service levels and interference?
This TN describes analysis that can be done using the Visualyse Professional tool to study sharing between multiple non-GSO constellations.
Comparison of Orbits
The space traffic management of non-GSO constellations in LEO has two disadvantages compared to their operation in MEO:
- A greater number of satellites are required to provide global coverage
- For a given height separation between systems, there is room for fewer constellations.
The larger size of constellations at LEO can also make space traffic management more difficult as there could be separation required between planes of a specific constellation, in particular if they operate in polar orbits. For example, consider the numbers in the table below, where MEO is restricted to be up to a height of 20,000 km:
| Orbit | LEO | MEO |
|---|---|---|
| Maximum height (km) | 2000 | 20,000 |
| Minimum height (km) | 500 | 2000 |
| Separation (km) | 100 | 100 |
| Total systems | 15 | 180 |
It can be seen that there is the potential in MEO to have many more constellations that at LEO for a given separation distance, approximately equal to the number of countries.
There is the additional question of whether there would be sufficient angular separation between each to operate without interference? While this requires full simulation, a simplification can be done to make an initial assessment.
The solid angle of a cone with apex angle = is:
The total area over a sphere is 4 while the area above a minimum elevation angle of 30° is 4.1. With a cone around each satellite of 1° the area is around each 0.007 which suggests that in theory over 4,000 satellites could operate simultaneously. This would be reduced to 1,000 if each system has 4 co-frequency beams active simultaneously at any location. The situation is made more complicated by the motion of each satellite. However, even if this approach over-estimates by a factor of 5, there'd still be room for 200 systems.
The downside to moving from LEO to MEO is increased latency, as can be seen in the table below:
| Orbit | LEO | MEO | GSO |
|---|---|---|---|
| Distance (km) | 1,000 | 8,000 | 35,786 |
| Latency (mS) | 6.7 | 53.3 | 238.6 |
It can be seen that the latency at MEO is higher than that at LEO. However, it is significantly less than for GSO and might be sufficiently low for many classes of service. In addition, the overall system latency is affected by other additional elements of the system design.
This study therefore considered a sharing scenario involving non-GSO constellations in MEO orbit to see if it was feasible for 20 systems to operate co-frequency simultaneously without harmful interference.
Analysis Approach
The approach taken was to create two reference systems with the following parameters:
| System | A | B |
|---|---|---|
| Number of planes | 4 | 5 |
| Satellite/plane | 6 | 5 |
| Height (km) | 8,000 | 9,000 |
| Inclination (deg) | 55 | 55 |
| Phasing between planes (deg) | 30 | 30 |
| GSO arc avoidance (deg) | 5 | 5 |
| Minimum elevation angle (deg) | 30 | 30 |
| ES latitude (deg N) | 50 | 50 |
| ES longitude (deg E) | 0 | 0 |
The link parameters, selected to give system A an availability of 99.5%, were as in the following table:
| Direction | UL | DL |
|---|---|---|
| Frequency (GHz) | 48 | 38 |
| Transmit power (dBW/MHz) | -10 | -15 |
| Receive temperature (K) | 300 | 150 |
| Tr(C/N) (dB) | 5 | 5 |
The antenna characteristics are given in the table below:
| Antenna | ES | Satellite |
|---|---|---|
| Dish size (m) | 0.6 | 0.5 |
| Efficiency | n/a | 0.6 |
| Gain pattern | Rec. ITU-R S.1428 | Rec. ITU-R S.1528 |
The gain pattern in Rec. ITU-R S.1428 is shown in the figure below.
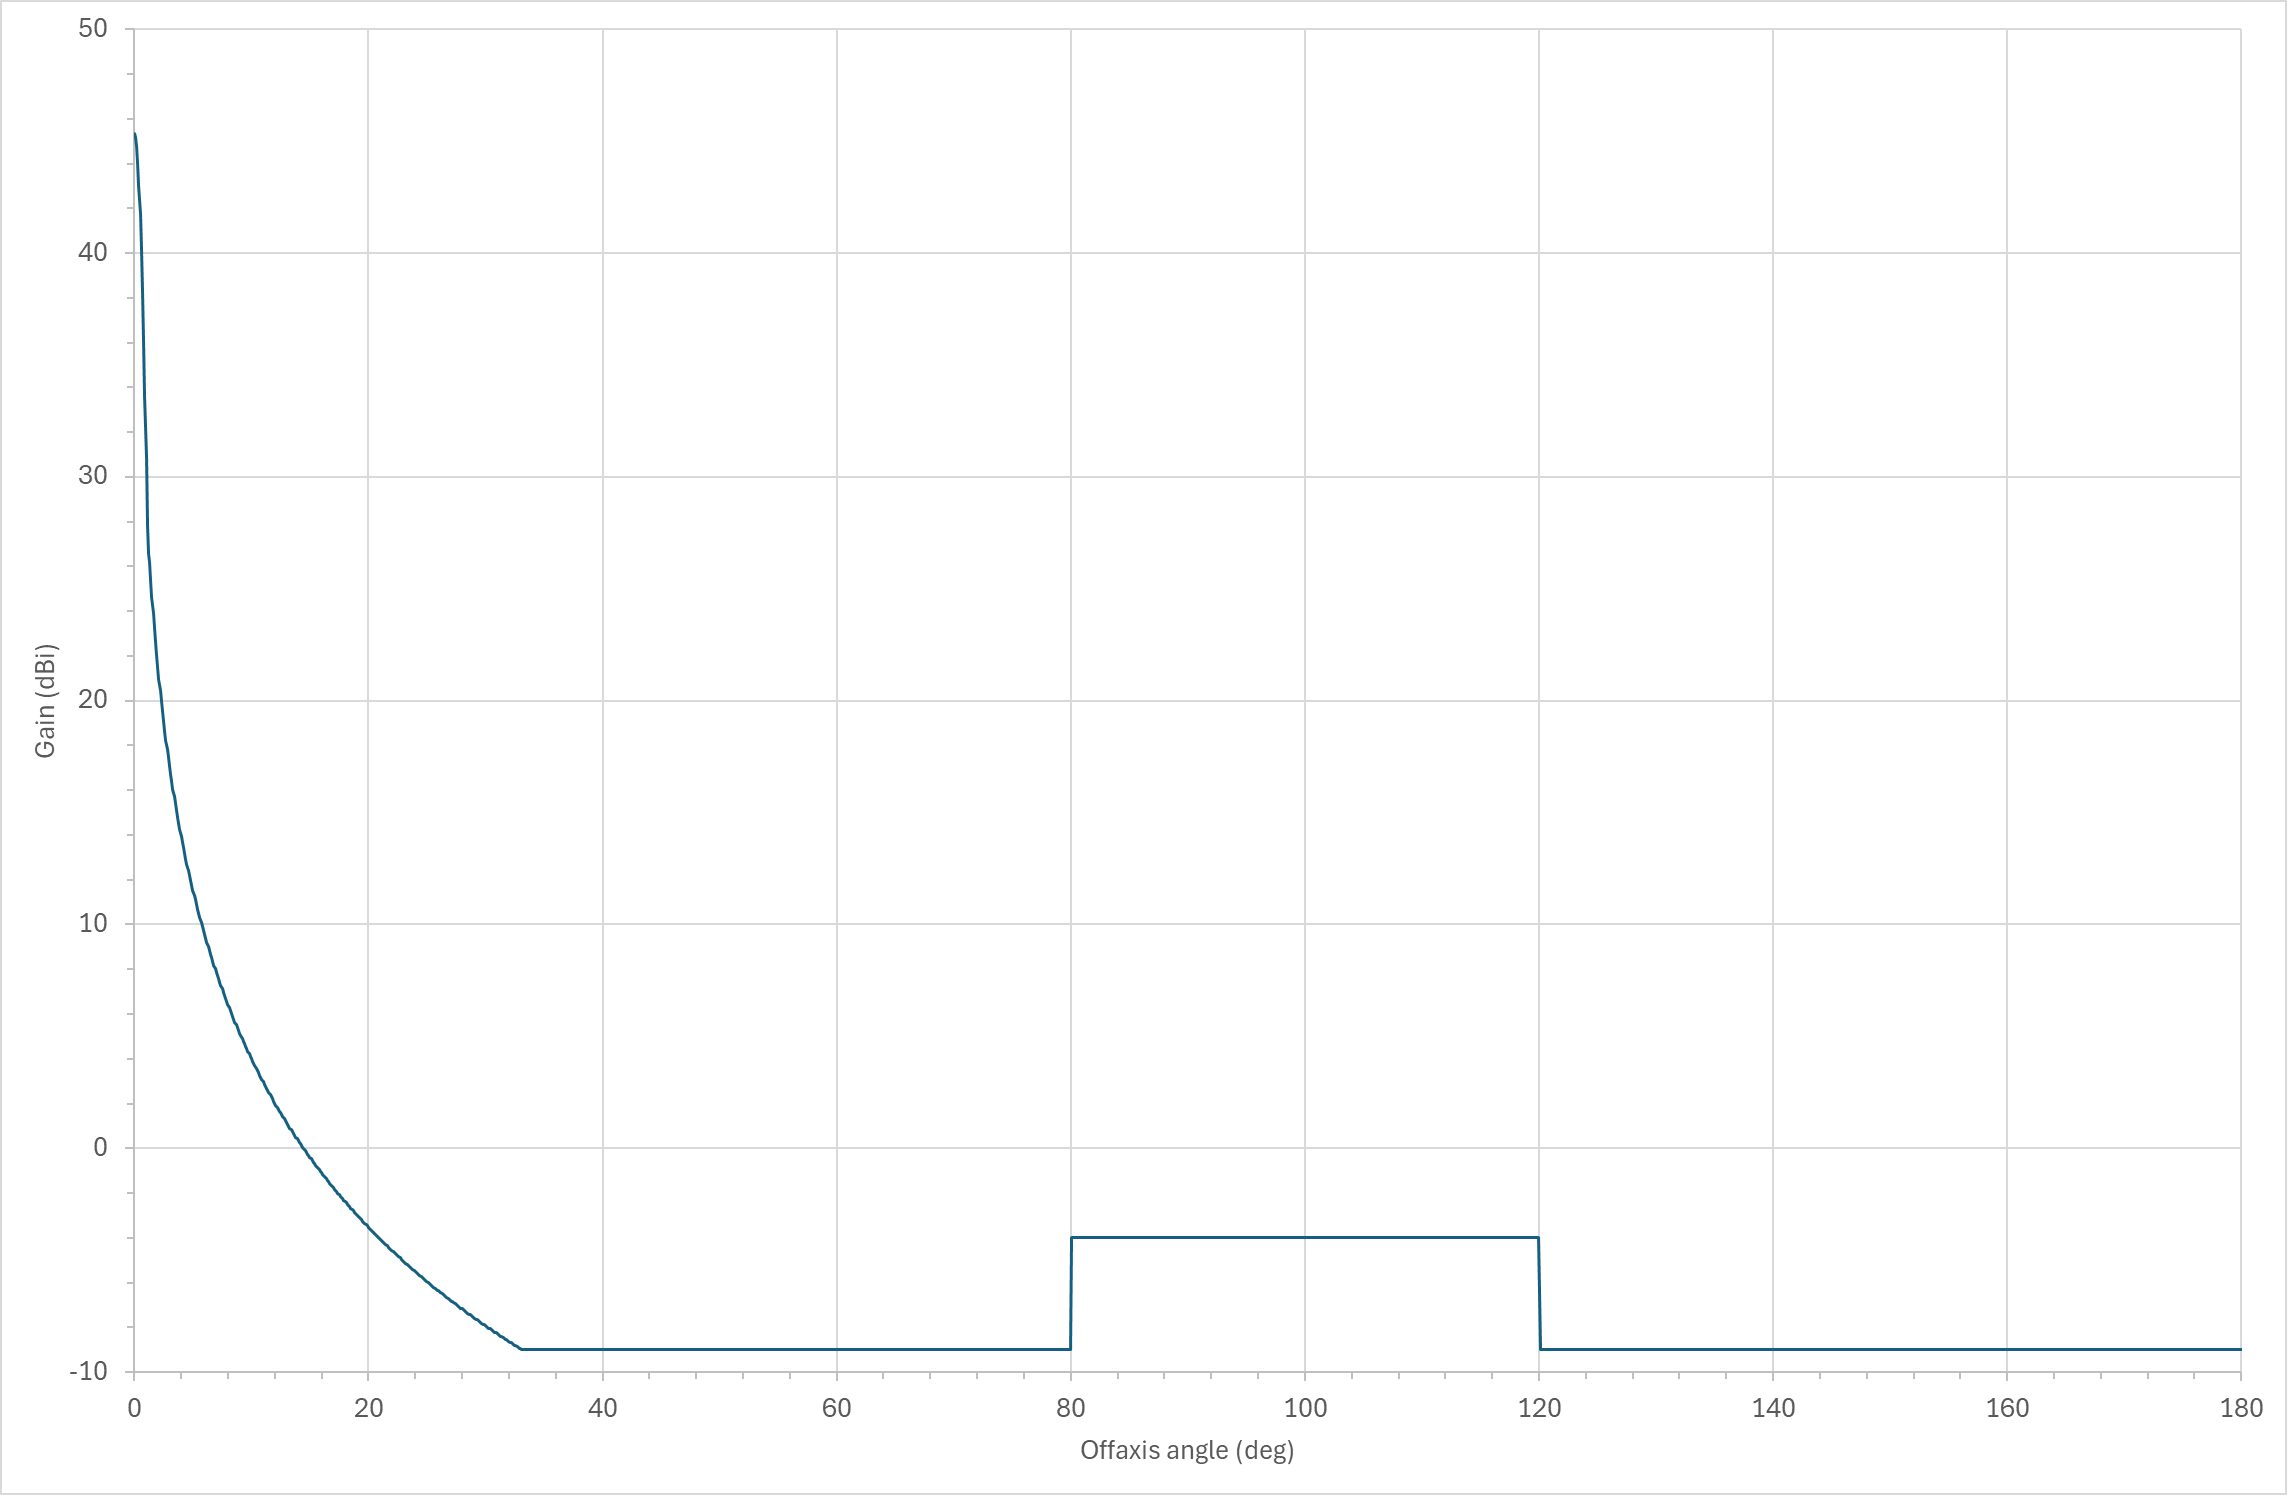
Note that the relative gain at off-axis angles of 1° and 5° (used in the satellite selection) corresponds to relative gains of -14.5 dB and -33.8 dB respectively.
From this baseline, each of the reference systems A and B were replicated 10 times, with 100km added to the height in each case and additional offsets added to the initial argument of perigee and longitude of the ascending node.
The following propagation models were used:
- Recommendation ITU-R P.525: free space path loss
- Recommendation ITU-R P.618: rain fade
- Recommendation ITU-R P.676: gaseous attenuation.
Given all the ES were co-located, the percentage of time used in Recommendation ITU-R P.618 was fully correlated between all links and wanted/interfering paths.
Each constellation position was updated using Monte Carlo methods for 1,000,000 time steps. Interference was calculated assuming that all systems were operating co-frequency and their ES co-located.
The following statistics were gathered:
- Percentage of time for which a satellite was available
- Link availability and throughput
- Reduction in link availability due to interference
- Reduction in throughput due to interference.
In addition, CDFs of the {I/N, C/N, C/(N+I)} were collected.
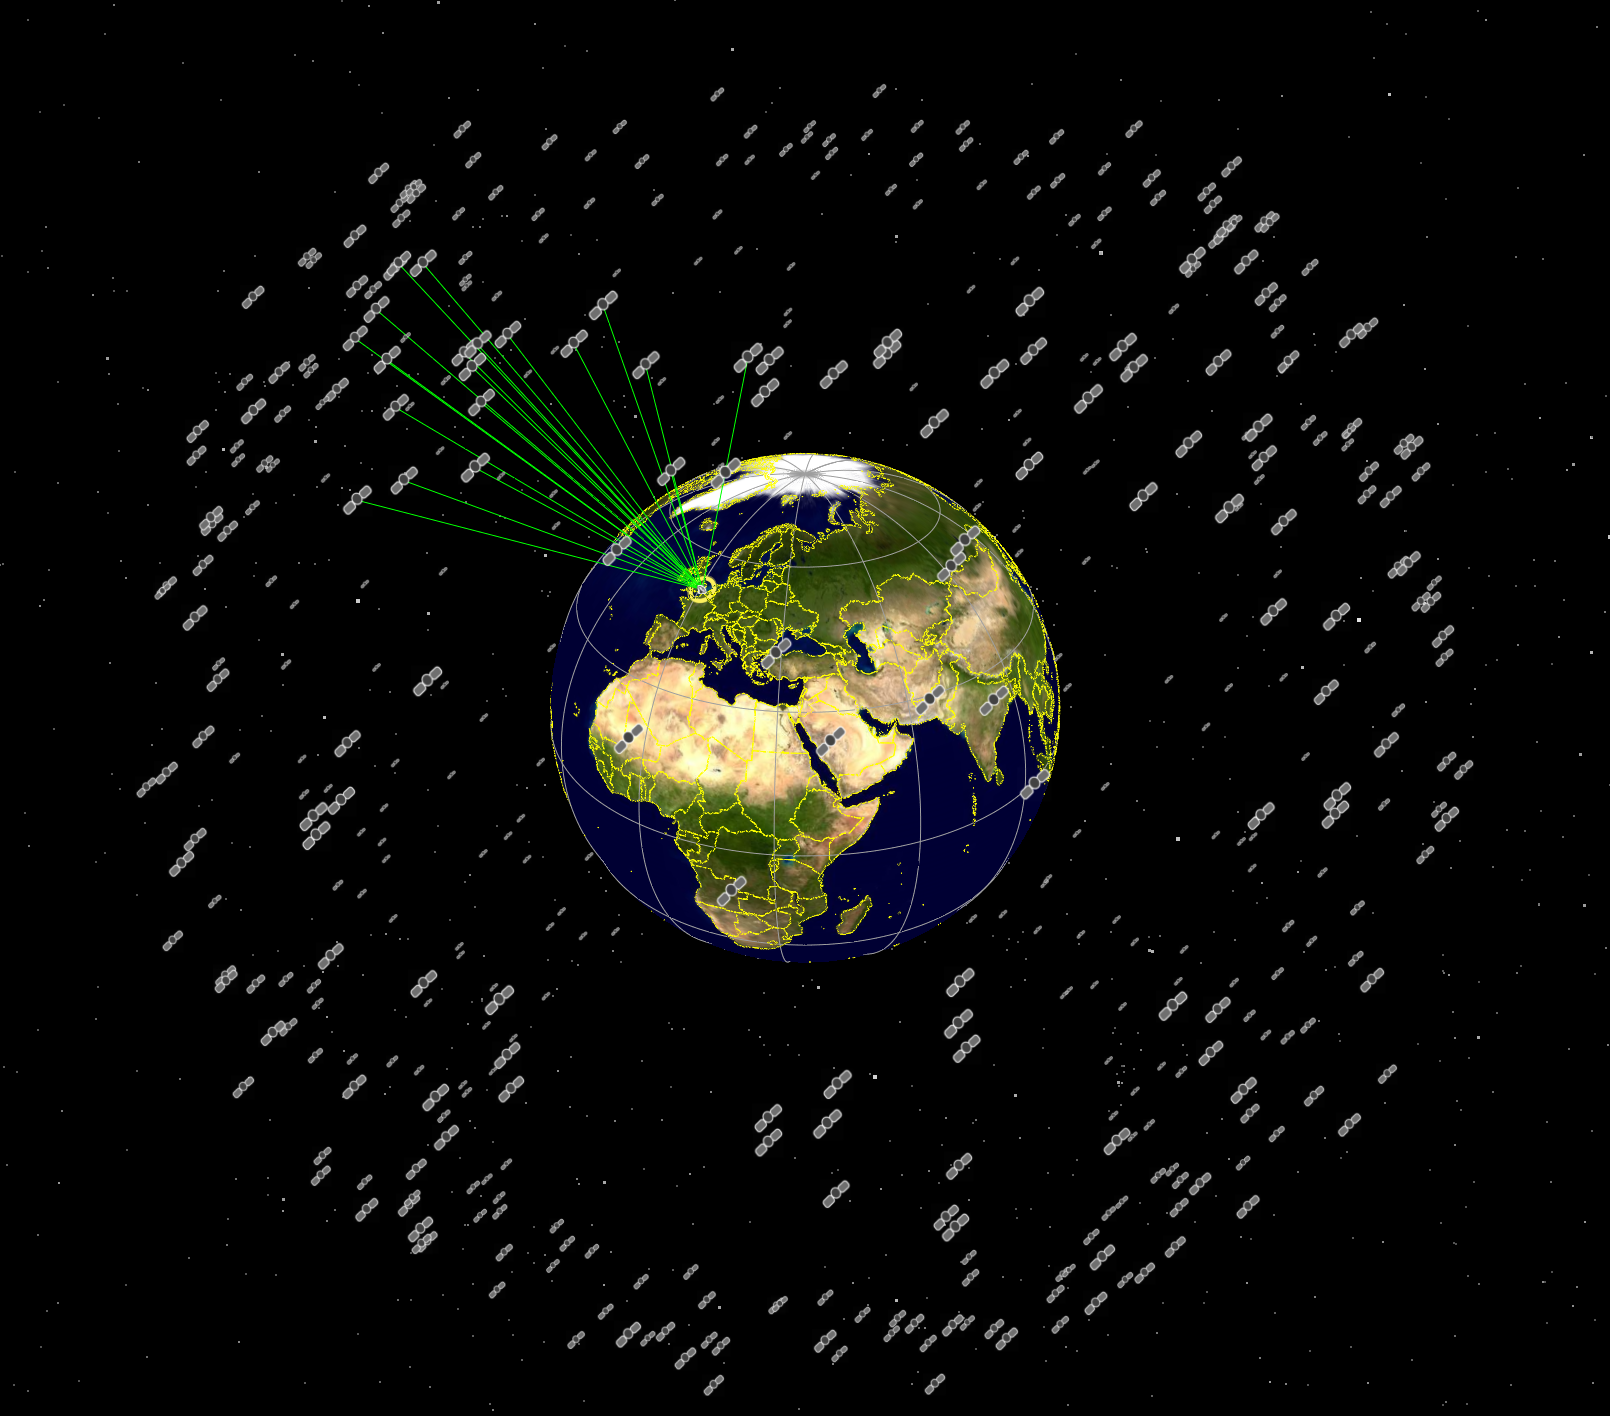
The resulting simulation is shown in the figure below:
A number of variations for this scenario were considered:
- No mitigation
- Avoid Pointing of another system’s satellites by 1°
- Avoid Pointing of another system’s satellites by 1° only if that satellite is actively serving an ES.
Further variations on the Avoid Pointing scenarios considered the impact on one of the systems having more satellites and more simultaneously active links to the ES location.
Results of Simulations
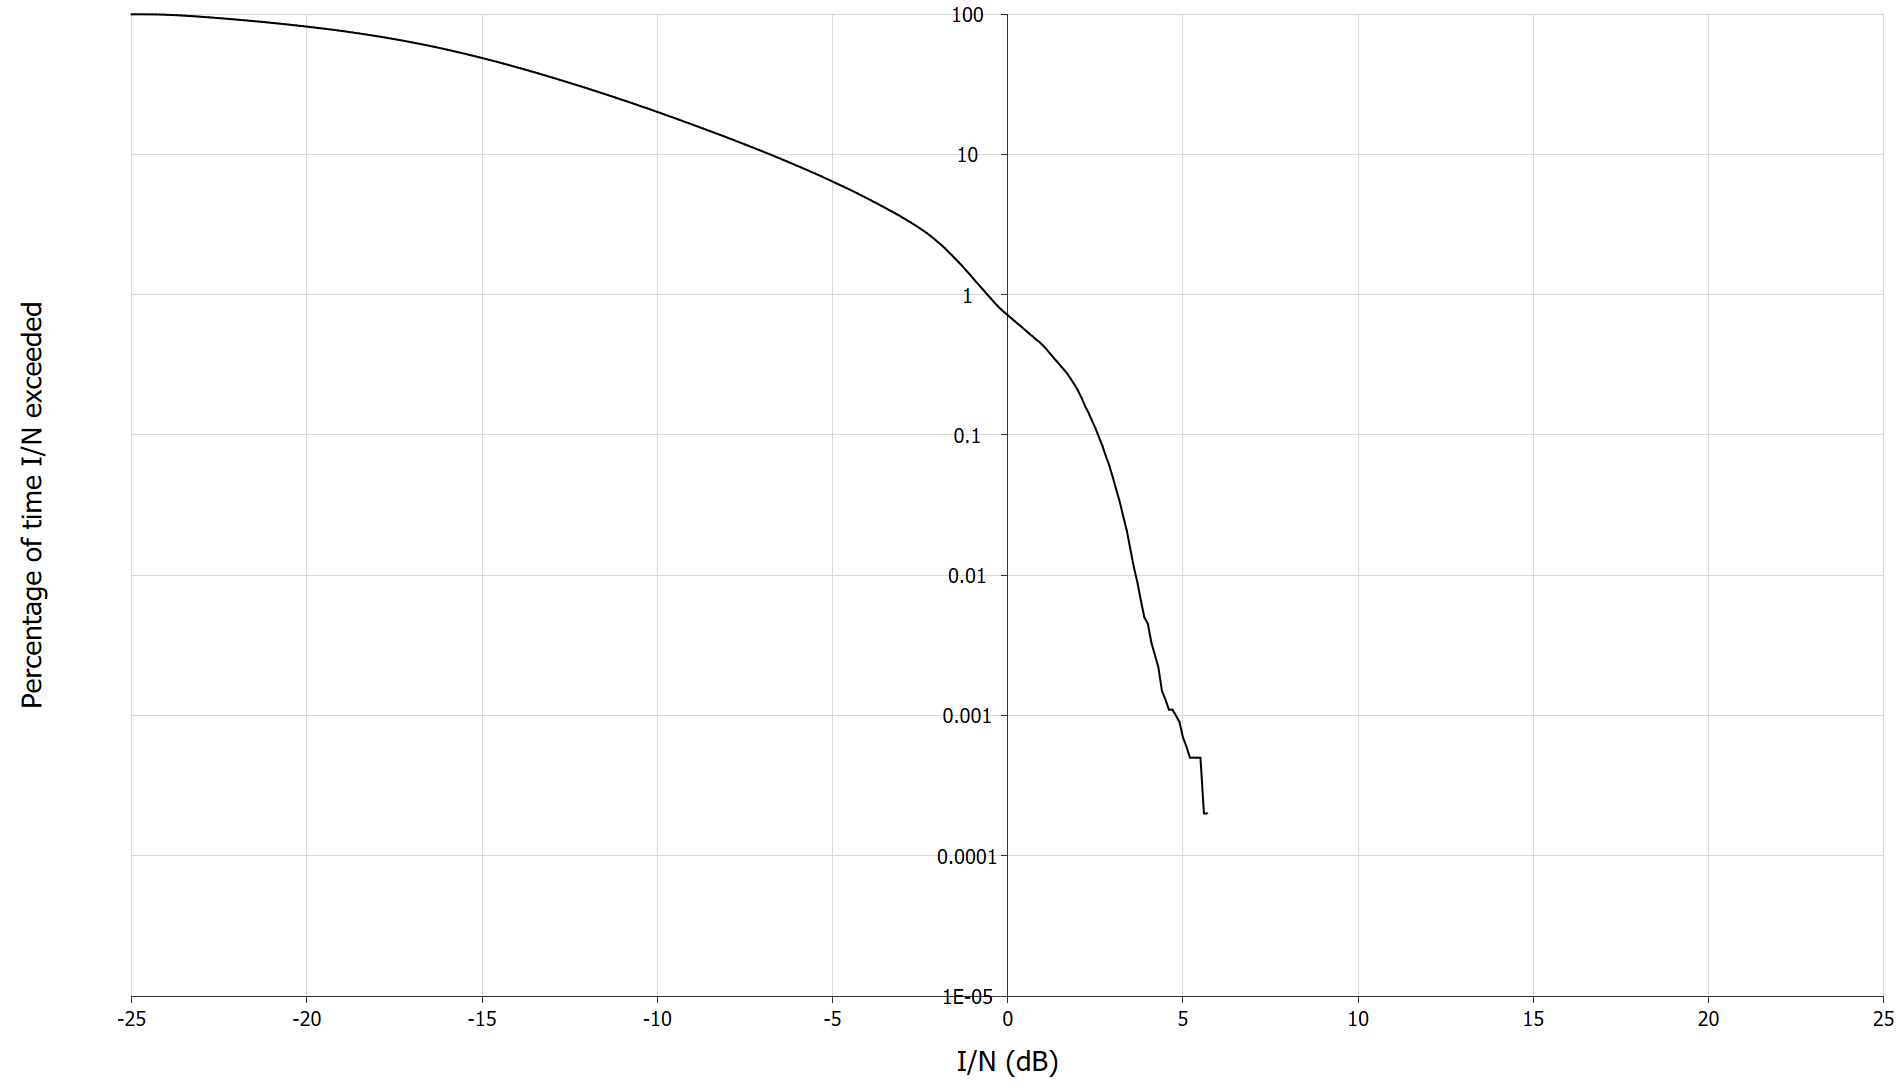
No Mitigation Run
For the no mitigation run, there was significant interference as can be seen by the I/N and C/N to C/(N+I) plots below for the downlink for the first constellation’s link:
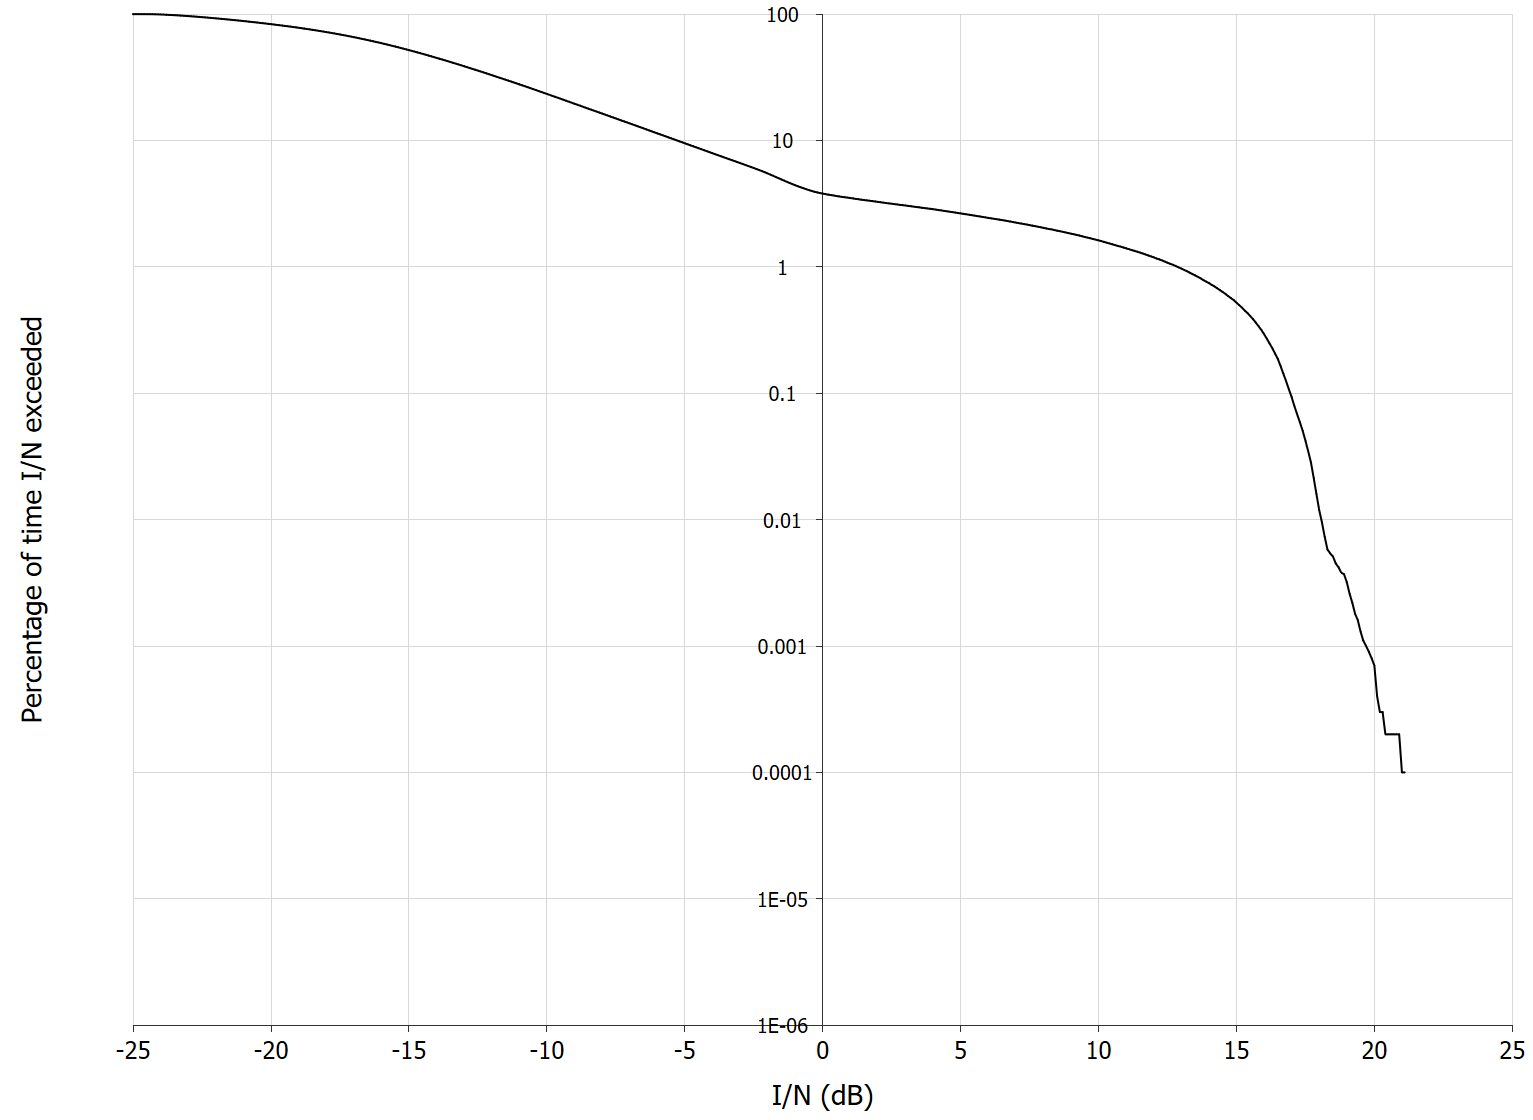
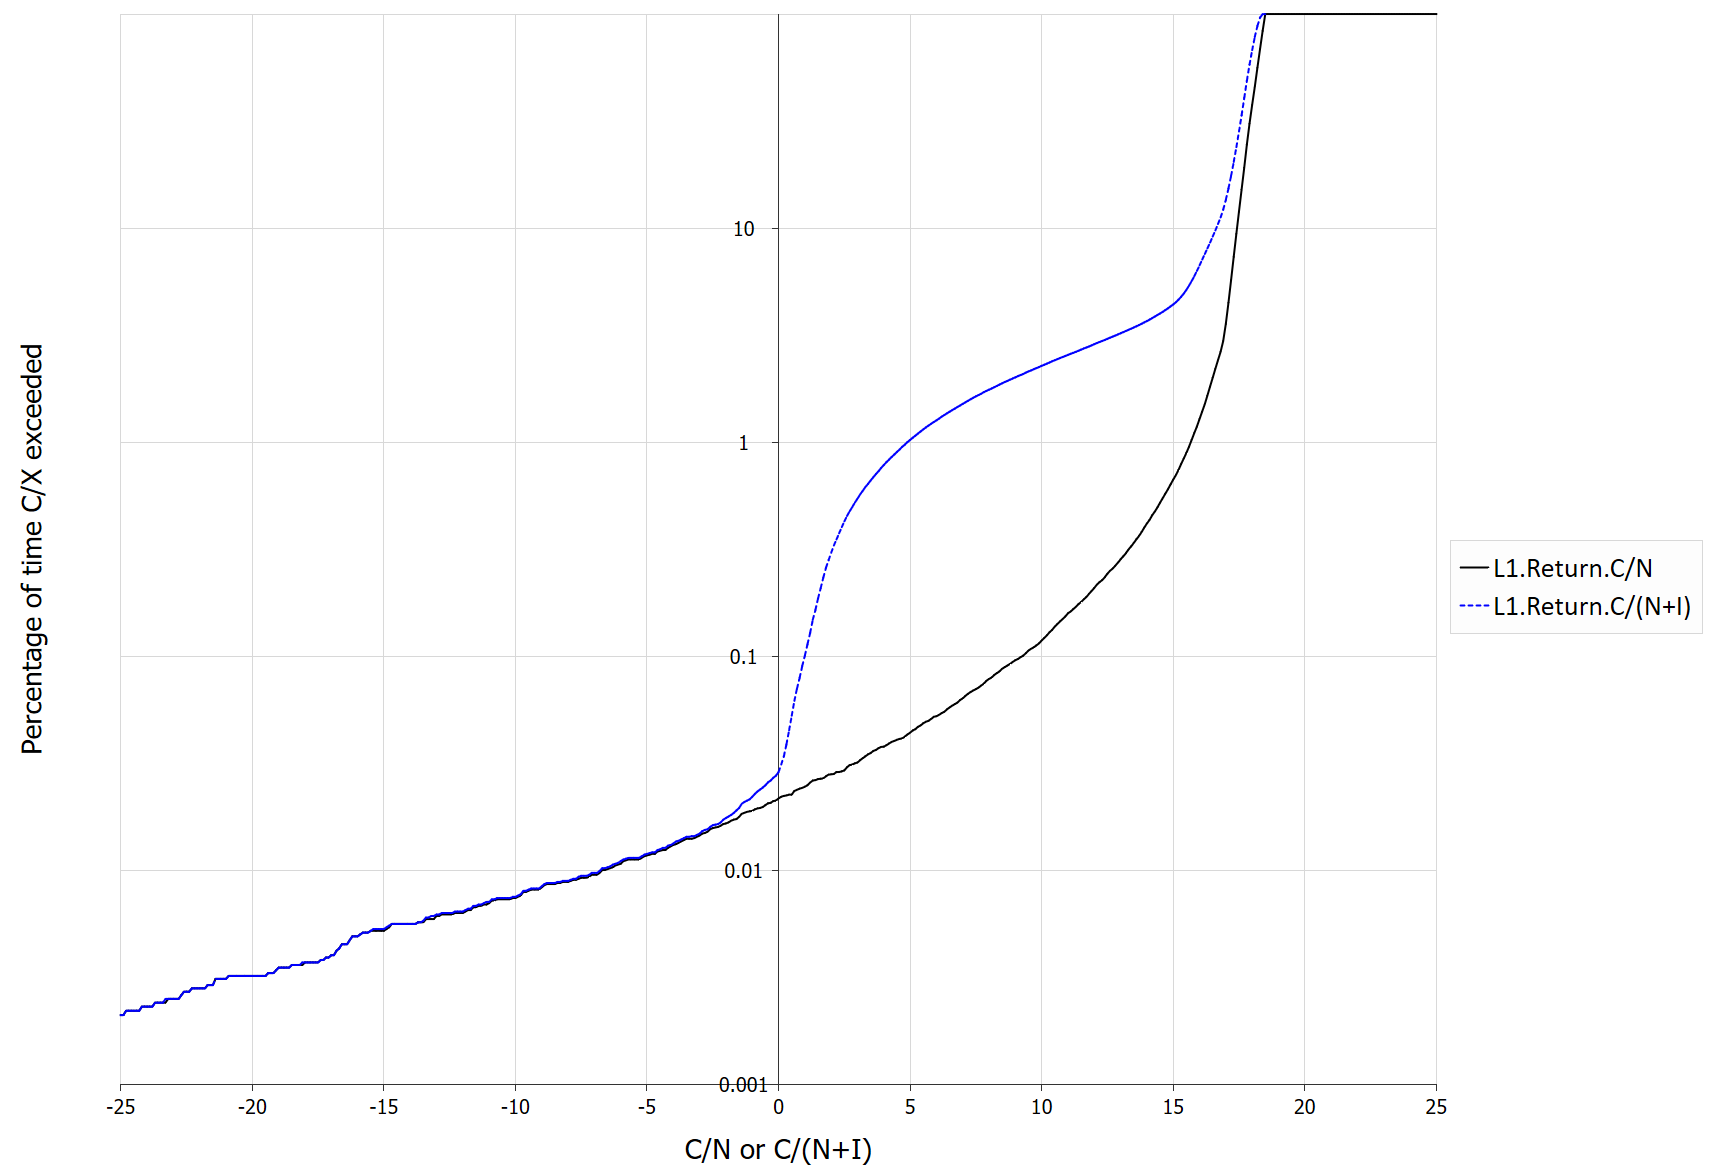
This resulted in terms of increase in unavailability for this link are shown in the table below:
| Unavailability without interference (%) | 0.044 |
|---|---|
| Unavailability with interference (%) | 1.024 |
| Increase in unavailability | 0.980 |
| Increase in unavailability (%) | 2,237.0 |
| Throughput without interference (bits/Hz/timestep) | 4,059,926.5 |
| Throughput with interference (bits/Hz/timestep) | 3,909,866.4 |
| Loss of throughput | 150,060.1 |
| Loss of throughput (%) | 3.7 |
The other constellations had similar results.
These degradations in link performance are likely to get worse as the number of constellations increases. Hence to allow large numbers of constellation, some degree of mitigation is required. One such mitigation is Avoid Pointing, as discussed in the next section.
Avoid Pointing by 1° Run
This simulation file had each constellation Avoid Pointing towards any of the other’s satellites by at least 1°. This did not take account of whether the satellite was actually providing a service at the given location.
The figures below the I/N and C/N to C/(N+I) plots for the first constellation’s link downlink to compare with the results above:
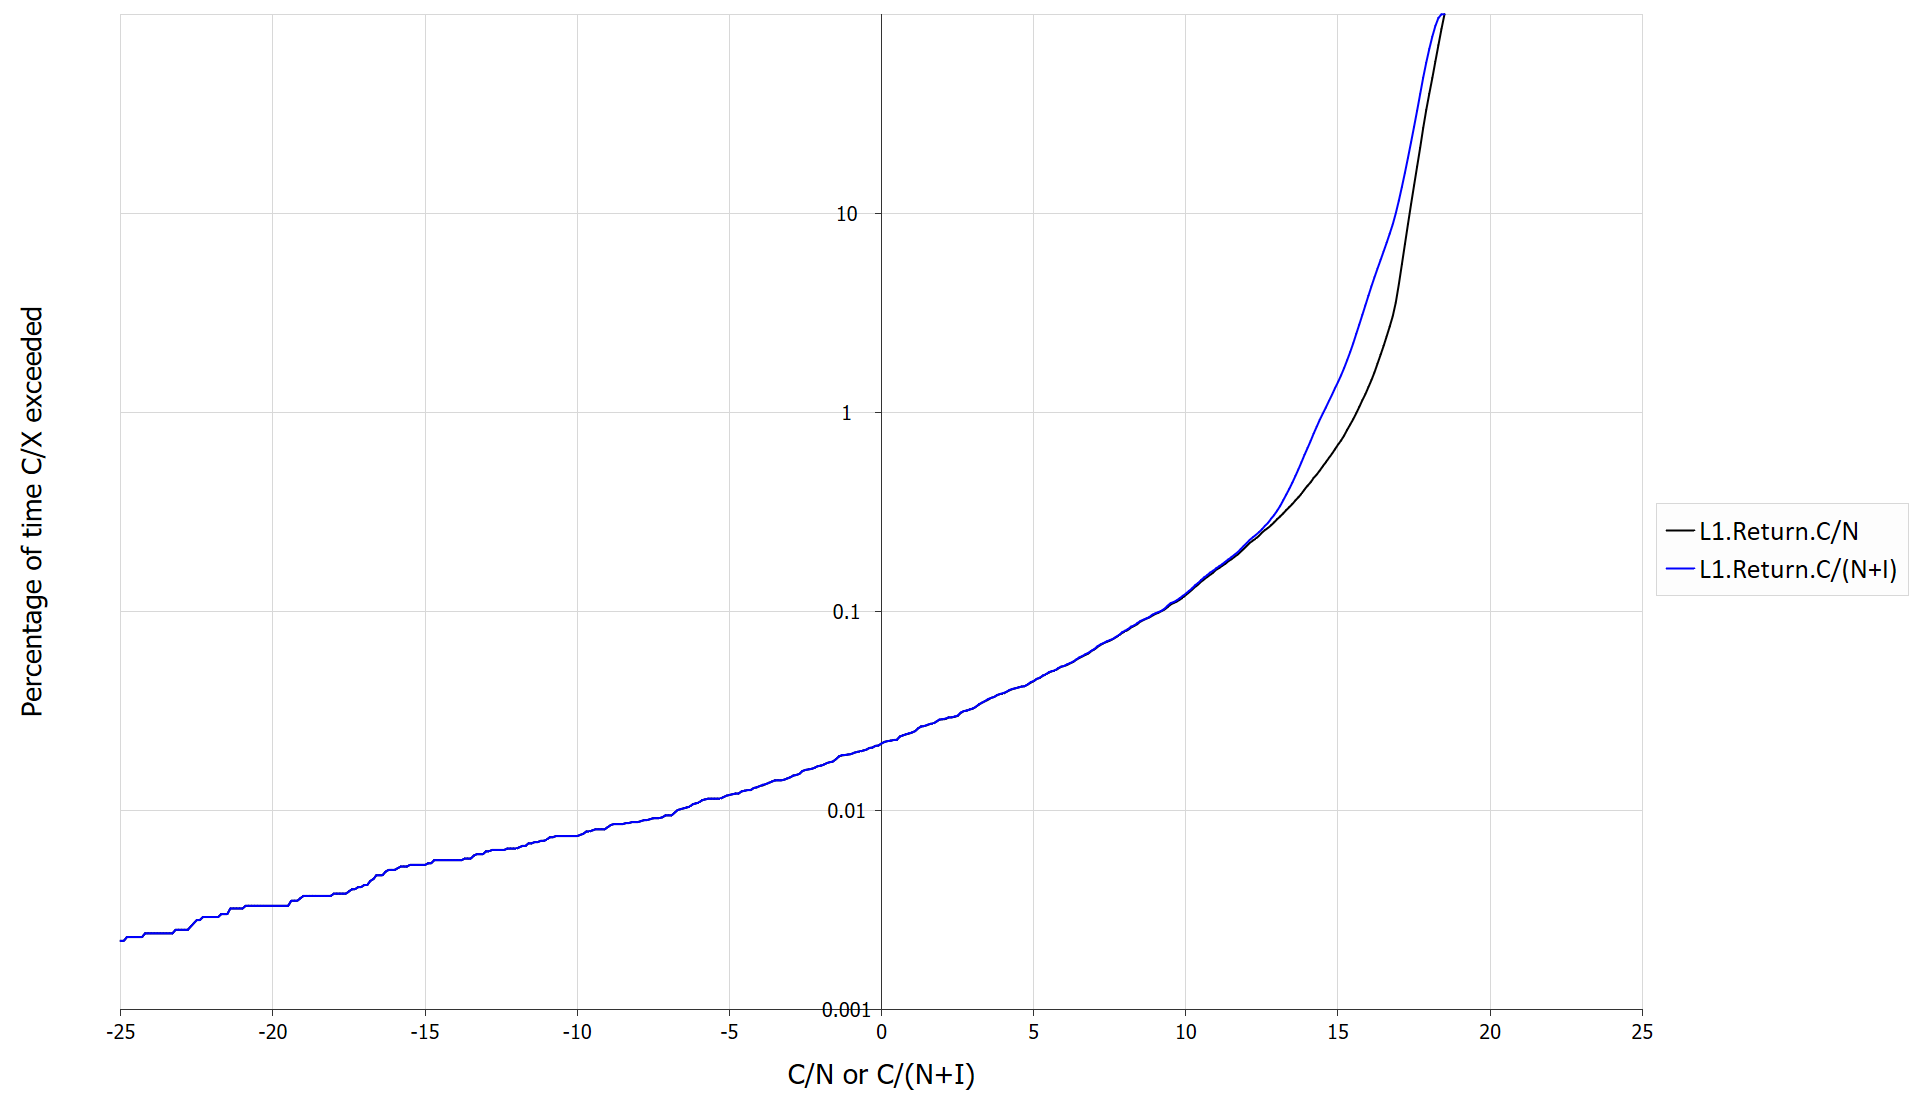
It can be seen there is a significant reduction in interference. The resulting link metrics of increase in unavailability and decrease in loss of throughput, as shown by the table below:
| Unavailability without interference (%) | 0.044 |
| Unavailability with interference (%) | 0.045 |
| Increase in unavailability | 0.000 |
| Increase in unavailability (%) | 0.2 |
| Throughput without interference (bits/Hz/timestep) | 4,044,052.7 |
| Throughput with interference (bits/Hz/timestep) | 3,964,524.0 |
| Loss of throughput | 79,528.6 |
| Loss of throughput (%) | 2.0 |
It can be seen that the mitigation method was effective at reducing harmful interference as measured using the increase in unavailability or loss of throughput metrics.
The disadvantage of the Avoid Pointing method is that there are times when there are no satellites visible. For this set of constellations, the unavailability of satellites ranged from 0.21% to 0.57% of the time. As the number of constellations increases, this unavailability of satellites is likely to increase.
However, there are mitigation methods that can reduce this unavailability of satellites:
- Increase the number of satellites in the constellation, to allow additional routing options
- Only avoid satellites that have an active beam in the direction of the victim ES
- Rather than both systems avoiding each other, share the burden, for example by each system avoiding the other for half of the conjunctions.
If the second method were to be employed, this would reduce the unavailability of satellites to be below 0.03% of the time. However, this type of avoidance methodology would require information to be exchanged, either directly between constellation operators or via a managed service from a trusted third party. This latter approach could respond to requests from one operator to transmit on a specified frequency to a given location using agreed rules and algorithms without revealing details about the other systems.
Avoid Pointing by 1° with one Larger Constellation Run
In the example above, all the constellations had either 24 or 25 satellites. But what would be the impact of one of the constellations being significantly larger than the others?
The simulation file was modified to have the first constellation have the following parameters:
| Number of planes | 18 |
| Satellite/plane | 12 |
| Height (km) | 8,000 |
| Inclination (deg) | 55 |
| Phasing between planes (deg) | 10 |
Rather than having a single link active, in this case there were 10, representing a = 10.
This larger constellation had a better satellite availability metric, with all 10 links able to find an available satellite at least 1° from all other satellites.
This larger constellation increases the constraints on the operation of other constellations, with the unavailability of satellites increasing to between 0.26% and 0.63%. Again, this can be mitigated by only avoiding those satellites that are active, which reduces the unavailability of satellites to under 0.06% of the time. This might be sufficient, depending upon service, though the average loss of throughput was slightly higher at just over 3%. So, there could be trade-offs to consider between:
- Number of constellations operating simultaneously
- Number of satellites per constellation
- Number of co-frequency co-located links per constellation
- Satellite availability requirements
- Link metrics such as unavailability and throughput and the impact of interference
- Level of information exchanged between operators.
Further Topics to Consider
These represent initial results and further consideration would be required, to address questions such as:
- What would be the impact of additional non-GSO systems on the sharing environment?
- How many systems can share simultaneously?
- How is the number of active systems affected by the number of simultaneously active ES from each system at each location (the )?
- How is the interference environment affected by aggregate interference from other locations?
- What is the trade-off between number of systems that can share and the ES dish size / satellite antenna beamwidth?
- What would be the impact of using other gain patterns, including beamforming antenna pattern in Recommendation ITU-R M.2101
- What would be the impact of power control on the sharing?
- Should the transmit EIRP density be the same between systems or the PFD at the ES / satellite?
- What is a suitable separation in height between orbital planes?
- Could or should polarization effects be taken into account?
- What is the trade-off between avoidance angle in terms of interference (lower for larger avoidance angle) and unavailability of satellites (lower for smaller avoidance angles)?
- Are sharing conditions different for gateway operation (at specific locations) than for user terminals (UTs) (which could be ubiquitous)
- What would be the necessary separation distance between gateway locations?
Conclusions
This paper has shown how simulation tools such as Visualyse Professional can be used to analyse sharing scenarios involving large numbers of constellations to support work under AI 1.6.
This initial analysis suggested that:
- At least 20 constellations could operate in MEO with sufficient separation in height to allow low risk space traffic management
- Interference between these constellations could be mitigated by use of Avoid Pointing techniques
- At Q/V band, the angle required to avoid other satellites to harmful interference could be small
- Sharing can be more efficient if there is additional exchange of information between non-GSO satellite constellation operators, such as when and where beams are active
- This process could be facilitated by use of multi-lateral consultation and / or coordination meetings.
Further study would be required to reach definitive conclusions.