Abstract
Recently a number of new features have been added to Visualyse Professional to support the modelling of 5G / IMT-2020 systems, in particular the beamforming antennas, wanted signal path loss models, clutter loss models, UE deployment models and a TDD traffic model. This Technical Note (TN) describes step by step how to use these new features to build an example simulation with a single sector BS and 3 UEs, including comparing the results with other example implementations. In addition, this TN looks at ways to test and check simulations are behaving as expected.
Overview
Transfinite has been working on a series of upgrades to Visualyse Professional to include the features needed to model 5G / IMT-2020 systems.
There has also been increasing agreement at international groups as to the parameters and reference scenarios, together with example implementations.
This TN shows step by step how to use Visualyse Professional to build a single sector 5G system for urban environments in the 26 GHz band, including comparison of the results with other implementations.
Source Documents
The source documents used for this TN were:
- Recommendation ITU-R M.2101: Modelling and simulation of IMT networks and systems for use in sharing and compatibility studies
- Working Party 5D Attachment 2 on Spectrum Needs to a liaison statement to TG 5/1: Characteristics of terrestrial IMT systems for frequency sharing / interference analysis in the frequency range between 24.25 GHz and 86 GHz
- Annex 1 to Document 5-1/92-E Task Group 5/1 Chairman’s Report: System parameters and propagation models to be used in sharing and compatibility studies
- Section 4.17 of Document 5D/666 Chairman’s Report: Example implementation of the methodology in Recommendation ITU-R M.2101
Key Modelling Parameters
The scenario to be modelled was assumed to be a 26 GHz urban micro hot-spot, starting with a single base station. The parameters were therefore as described in the following sections:
Antenna Parameters
Antenna pattern from Rec. ITU-R M.2101 using parameters in 5D Attachment 2. This is the beamforming antenna with multiple peaks and nulls that can be steered at the UE, with pattern similar to this:

At 26 GHz the BS gain pattern is determined by the following parameters:
- 5 dBi element gain
- 8x8 elements
- Maximum scan angle 120°
UE gain pattern has the following parameters:
- 5 dBi element gain
- 4x4 elements
Station Parameters
The scenario involved a single BS at a height of 6m and with a single antenna, fixed physical downtilt = 10°. Initially it is assumed that the antenna is pointing due east i.e. azimuth = 90°.
The UE is located within the sector defined by the BS antenna azimuth pointing direction with non-uniform density as per ITU documentation.
The ITU documentation also gives a density of 30 BS/km2 and 100 UEs/km2. This averages 3.33 UEs/BS, here rounded down to 3.
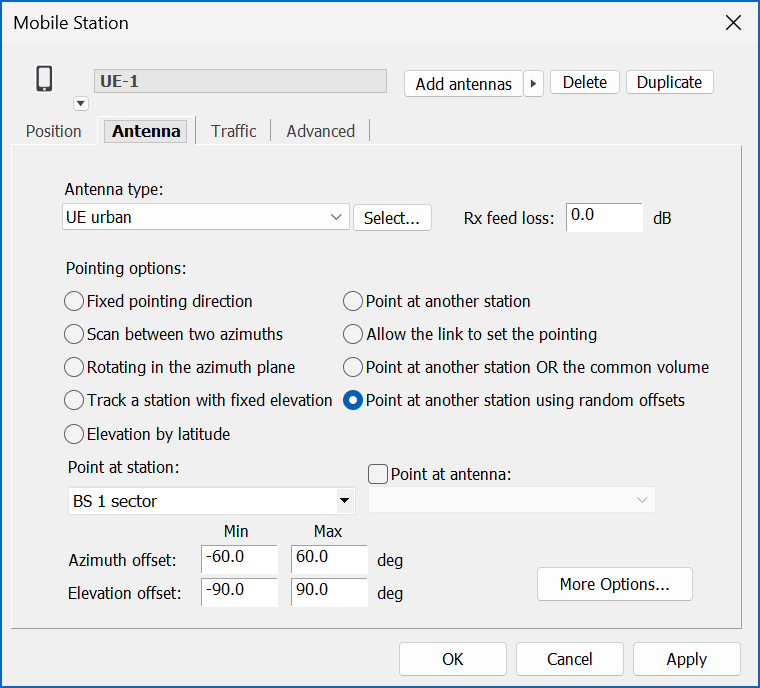
The UE physical pointing is towards the BS but with random offsets from that line of:
- Elevation random offset [-90°,+90°]
- Azimuth random offset [-60°,+60°]
Carrier Parameters
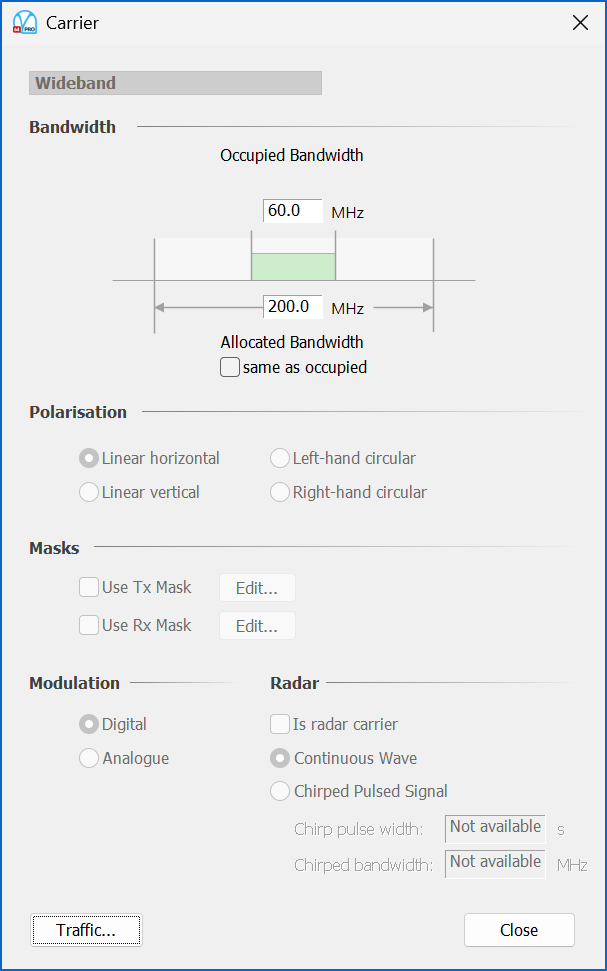
The total bandwidth is assumed to be 180 MHz (occupied) within 200 MHz (channel or allocated). With 3 UEs this equates to 60 MHz each, assuming each has the same number of resource blocks.
Propagation Parameters
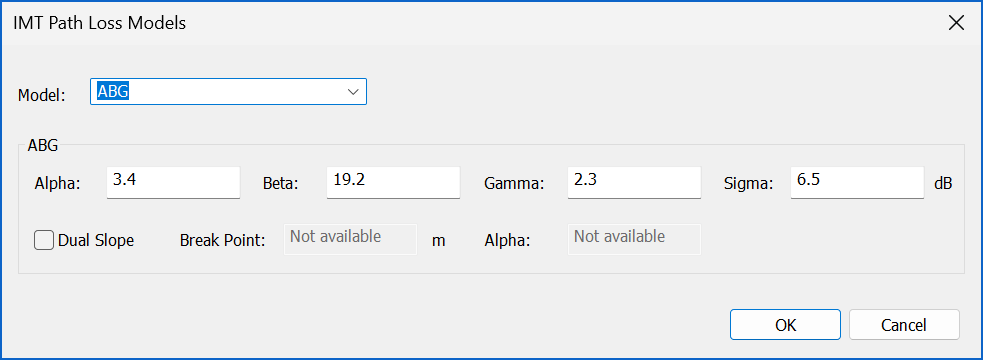
The model for the propagation loss of the wanted signal was assumed to be the ABG model with parameters:
The scenario also assumes body loss of 4 dB.
Link Parameters
This analysis is assumed to be in the 26 GHz band. The BS transmit power was constant calculated as follows:
where denotes the conducted power (before ohmic loss) per antenna element ( ), is the number of antenna elements and is the antenna array ohmic loss. With this power averaged over 3 UEs this works out as -9.7 dBW/UE.
The UE uplink was assumed to use power control with the following parameters:
The power control range was assumed to be 63 dB with maximum UE transmit power 22 dBm = -8 dBW. Hence the minimum UE transmit power = -71 dBW.
The noise figure was 10 dB i.e. T = 2900 K.
Approach
To go from these parameters to the completed simulation, the following steps will be undertaken:
- Configure a view to show the stations
- Add the antenna types with the ability to model the beamforming antennas
- Create the BS and the three UEs with the relevant antenna types and pointing methods
- Randomise the locations of the UEs using a define variable
- Create the carrier and configure the propagation environment
- Create the three links between the BS and the UEs using the carrier and propagation environment, and using power control for the uplink
- Identify which results and statistics to gather.
These steps are described in the following section.
Building the Simulation
The process starts by opening Visualyse Professional so there is a new, blank simulation open.
Configuring Mercator Map View
The first step is to configure the map view. For short range applications the best projection to use is Mercator, so open up a new Mercator view and close the default Plate Carree window.
Select the view properties and change the overlays to have the following two grids enabled and all others disabled, as follows:
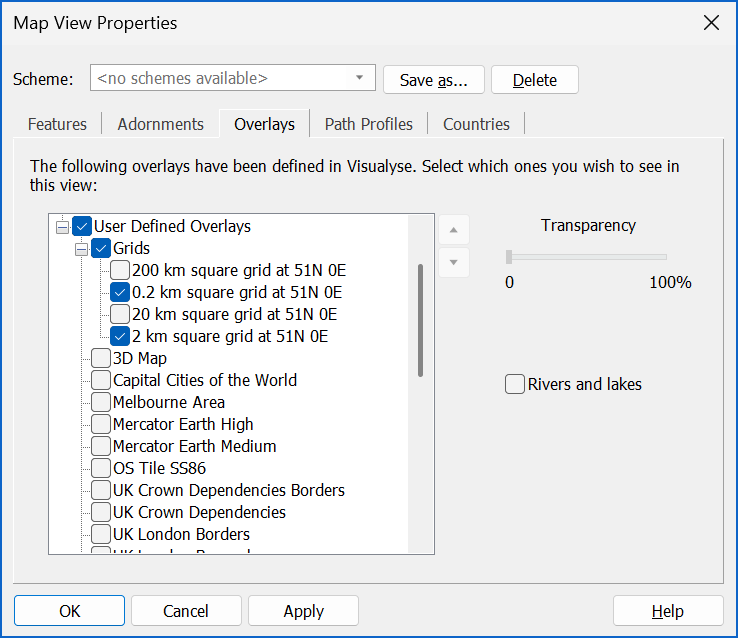
Zoom the view to the area around (51°N, 0°E) to see these grid overlays. These give spacing every 10m or 100m which helps get a sense of scale of the simulation.
Antenna Types
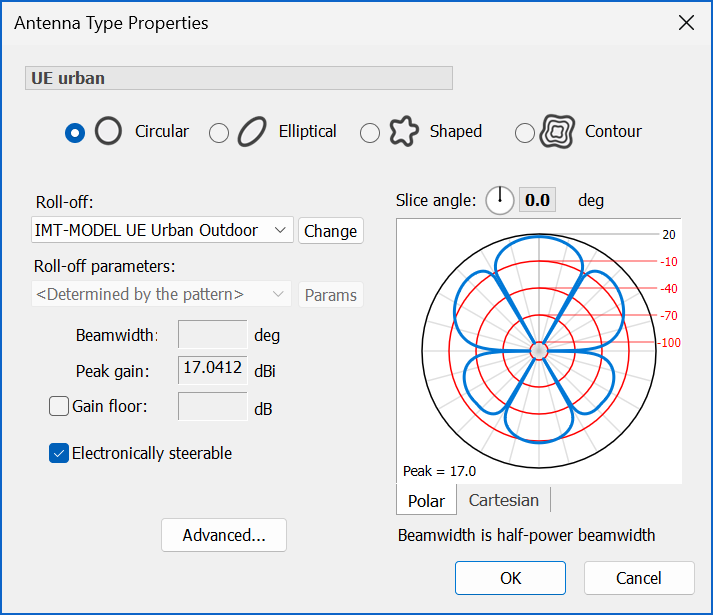
The next step is to create the antenna types, one for the BS and one for the UE. First up is the UE, for which the key steps are:
- Create a single beam antenna type and give it a name such as “UE Urban”
- Select the pattern to be “IMT-MODEL UE Urban Outdoor”: this selects the relevant parameters
- Ensure that the field “Electronically steerable” is enabled, as this allows it to point at the BS
The resulting dialog should look like this:
The BS is very similar, except it must be able to point at the UEs. The best way to model it as a multiple identical beam antenna type, with 3 beams, one per UE, each beam having the following characteristics:
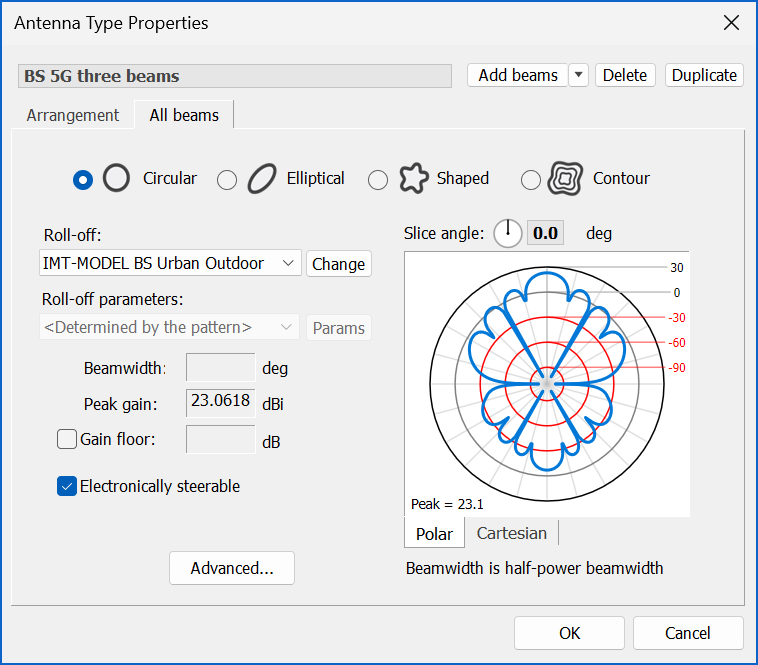
With each beam electronically steerable there is no need to set the arrangement as that will be done automatically when the link activates the beams.
Stations
The next step is to create the stations, in particular one BS and three UEs.
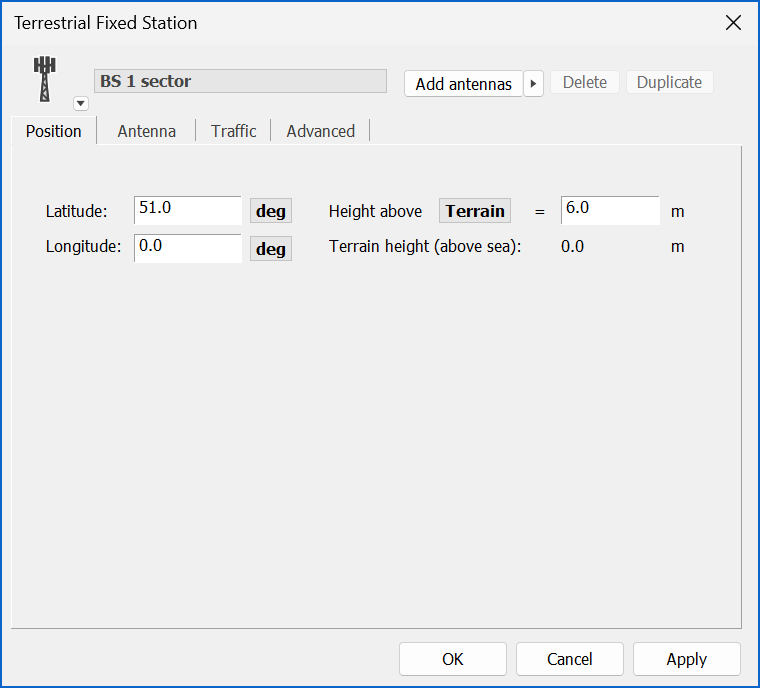
To create the BS make a new terrestrial station and then give it a name, such as “BS single sector”, and change the icon to something like a BS.
Then set its position to be at the centre of the grids, namely (51°N, 0°E) with height = 6m as in the following figure:
Then add an antenna and select the BS antenna type with pointing in the fixed pointing direction of (azimuth, elevation) = (90°, -10°).
All other parameters can be left unchanged.
The three UEs can be created by making one and then duplicating it twice. To create the first one add a new mobile station and then set its name and height to be 1.5m: it won’t be necessary to set the (lat, long) as that will be specified by the define variable for the random position within the sector.
However it is necessary to create the antenna and select the UE antenna type. Then the pointing must be at the UE with the random offset as per the following dialog:
This UE can then be duplicated twice to make the three UEs in this simulation.
Station Groups
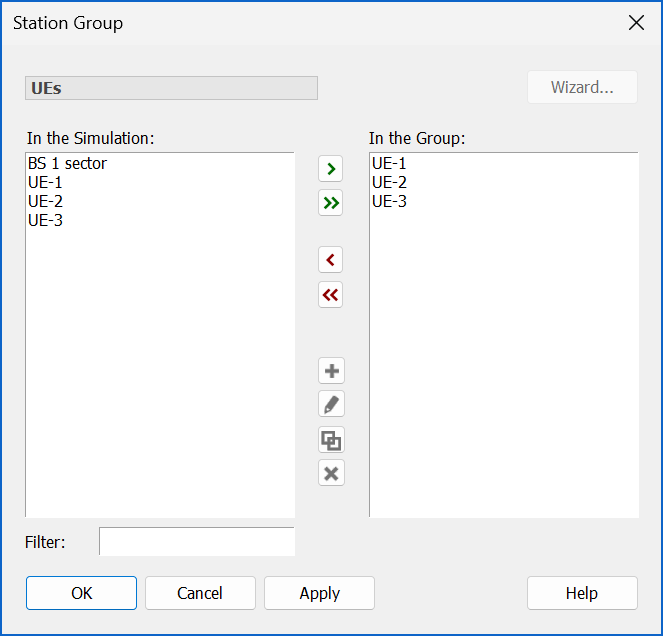
These three UEs should then be put in a station group or container: this will allow them to be randomised together more easily. It is also good practice to use groups to logically collect similar station types together.
The UE station group should look like this:
Define Variables
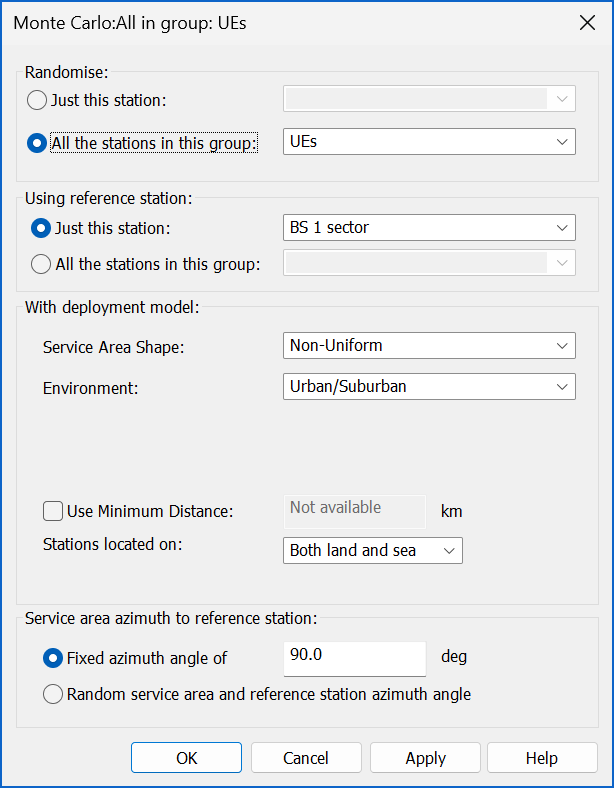
Having put all the UEs in the station group, they can then be positioned using a single define variable. In this case create a “service area Monte Carlo mobile” define variable and configuring so that:
- The relevant BS has been selected
- The group containing the three UEs has been selected
- The deployment model is selected to be the non-uniform density model for urban environments
- The orientation of the deployment is made to be consistent with the BS antenna, in this case pointing due east.
The final dialog should look like the dialog below.
Note that the example implementation used an alternative deployment model, namely uniform within a sector 120 wide and radius 0.1 km.
The result is that the 3 UEs are deployed at random in a sector to the east of the BS as per this screen shot:
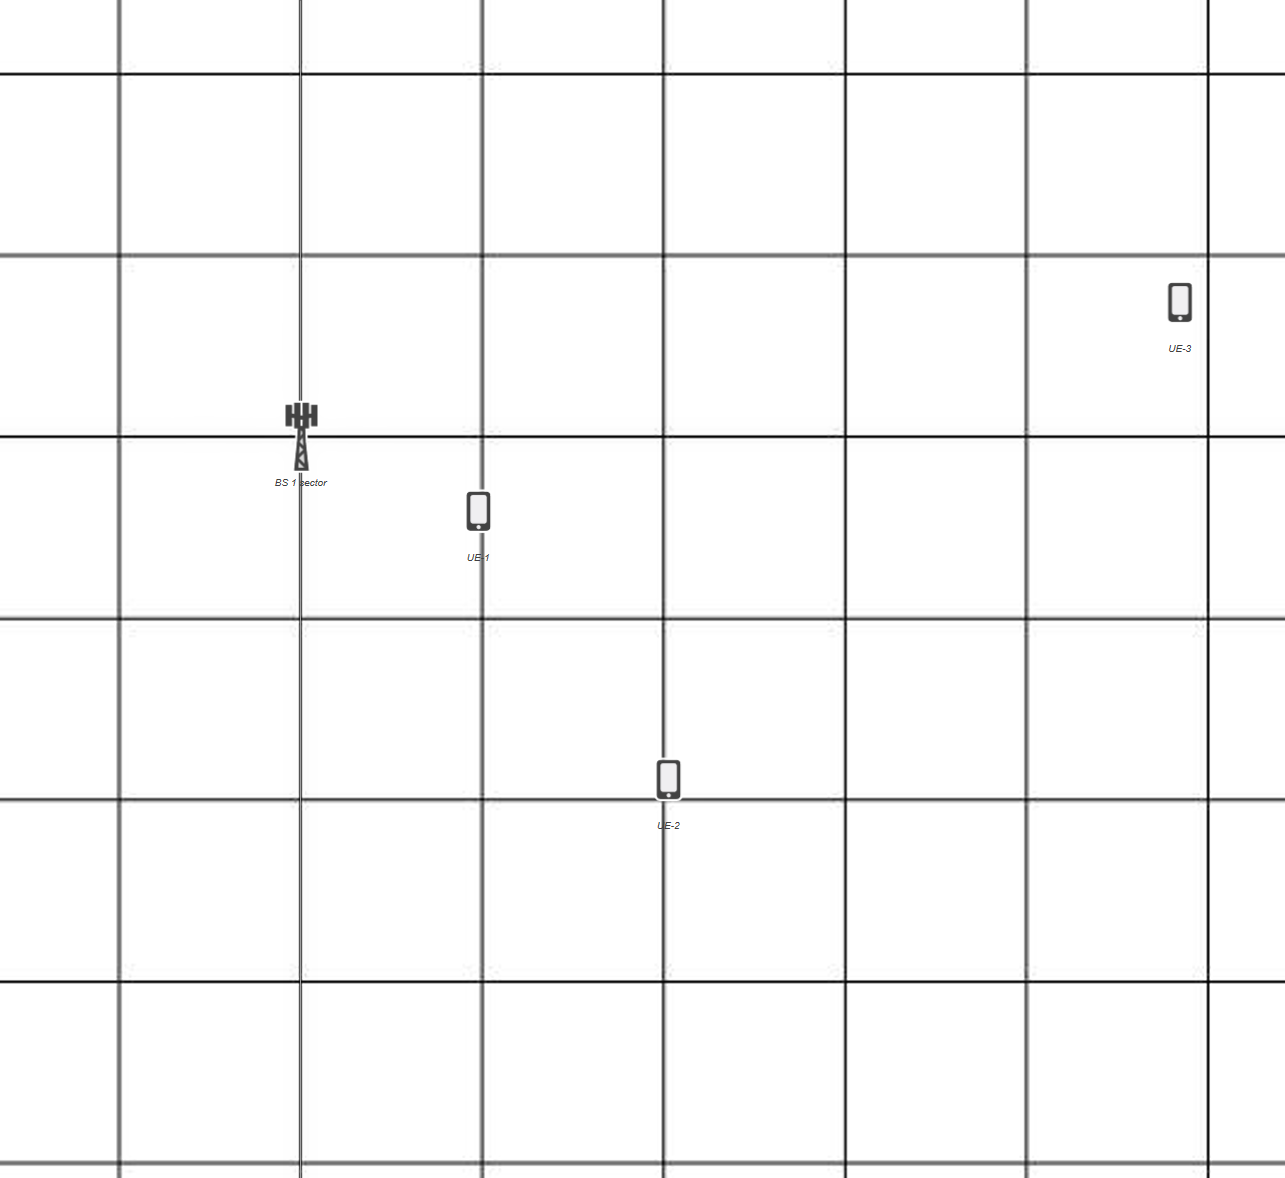
Note that the positions of UEs could be different from those in the screenshot above due to alternative random number seeds.
Carrier
The key parameter for the carrier is the occupied bandwidth as in the following dialog:
Propagation Environment
A key part of the model is the propagation model and this is defined by the propagation environment. The terrestrial mobile propagation environment should be configured to have the following models enabled for the propagation when wanted:
- IMT Path Loss Models
- Extra Models
The extra models should be set to a fixed loss of 4 dB to cover the body loss.
There are a number of options within the IMT Path Loss Models and the ABG model was selected to be consistent with the ITU document with an example implementation.
The various parameters can be entered as in the figure below:
Links
Visualyse Professional includes a range of different types of links and a key decision for those building simulations is which to select.
One way to select the appropriate one is to consider the features being modelled: in this case two key aspects are:
- The use of beamforming antennas at the BS and UEs
- The use of power control for the uplink from UE to BS
Both of these require use of a link with both a start and end station, and hence either a fixed or dynamic link. In this scenario it is expected there won’t be any handover and hence it is preferable to use a fixed link.
With multiple UEs there are two main ways to create N links without having to manually create each one by one:
- Create one link then duplicate it N-1 times and then edit them as required
- Use the link to station group wizard and then (if required) edit the links afterwards
In this case there are only three links and manual editing would be required if using the wizard anyhow, so it is suggested that the first approach would be easiest.
There are to be three links having:
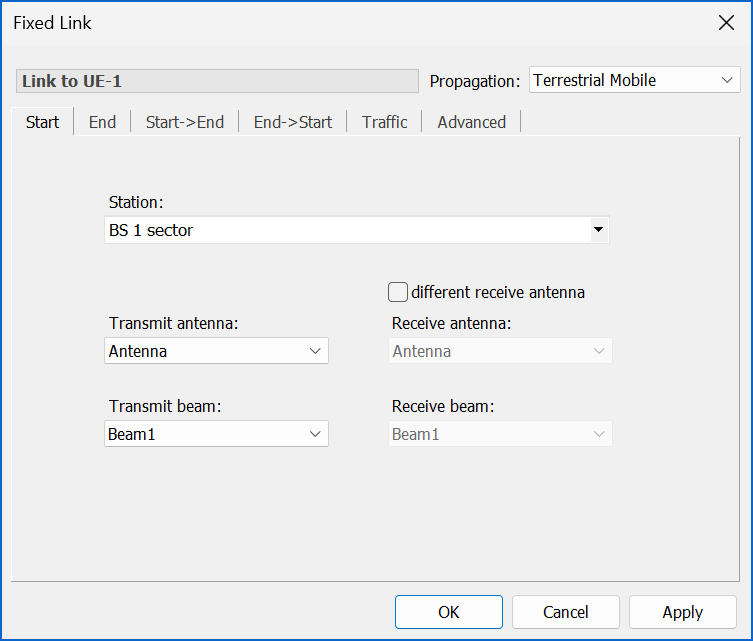
- Start station = BS, selecting beam N for link N
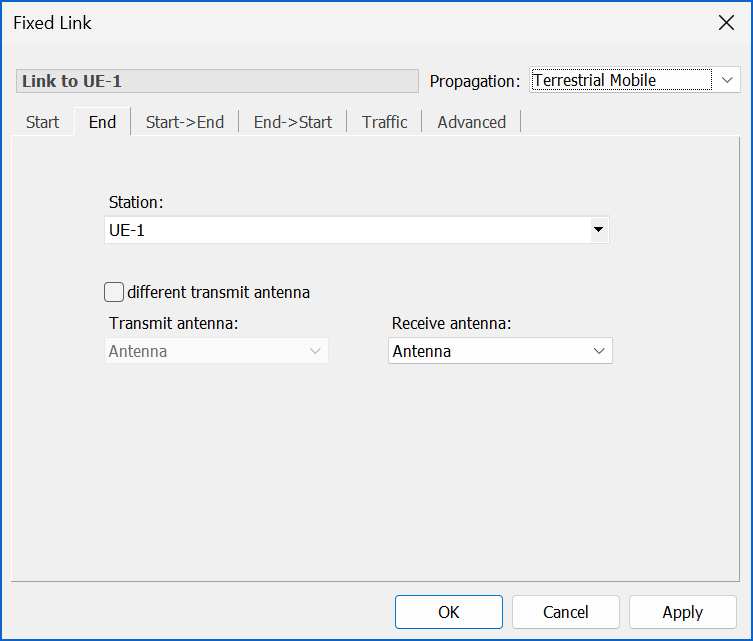
- End station = UE-N for link N
Hence each UE will be served by a different beam at the BS.
The first tab below shows the first beam being selected. Note the link has been given a name and the propagation environment selected.
The end station shows the first UE being selected – as being associated with the first beam at the BS:
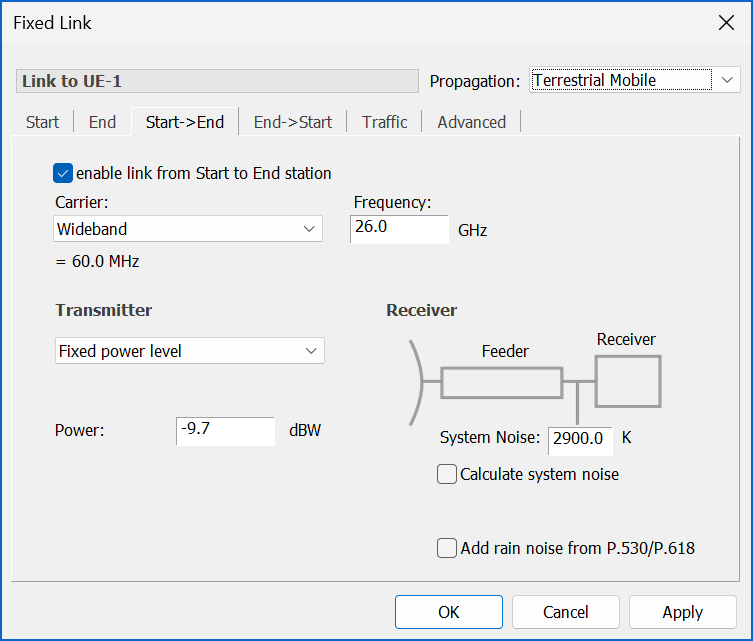
The start to end direction is the BS transmit case and the power is fixed at -9.7 dBW within the 60 MHz bandwidth coming from the carrier.
The noise temperature of the receiver, in this, the downlink case of the UE, is 2900 K.
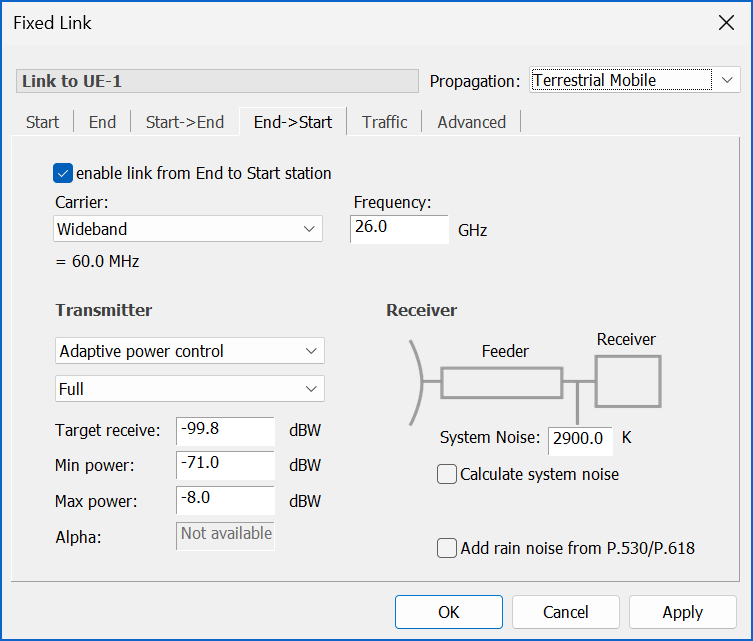
The end to start direction is the UE transmit case and hence power control is used with:
Target RSL = -99.8 dBW
Minimum = -71 dBW
Maximum = -8 dBW
The noise temperature of the receiver, in this, the uplink case of the BS, is 2900 K.
In both cases and directions the frequency is set to 26 GHz and the dialogs should be as in the figures below:
The other parameters can be left unchanged.
Having created one link then it can be duplicated to make three and the following changes made:
- Link 2: start station use beam 2 and end station be UE 2, possibly also f = 25.94 GHz
- Link 3: start station use beam 3 and end station be UE 3, possibly also f = 26.06 GHz
Link Groups
The three links can then be placed into a link group.
Statistics
The statistics that are to be collected will depend upon the requirements of the study. In this case the outputs are intended to be similar to those in the example implementation, namely CDFs of:
- C/N of the downlink
- Gain at the BS towards the UE
- Transmit power at the UE
This can be done by opening the statistics collection option and selecting to collect C/N stats and to create a distribution of with 0.1 dB resolution, as in the following dialog:
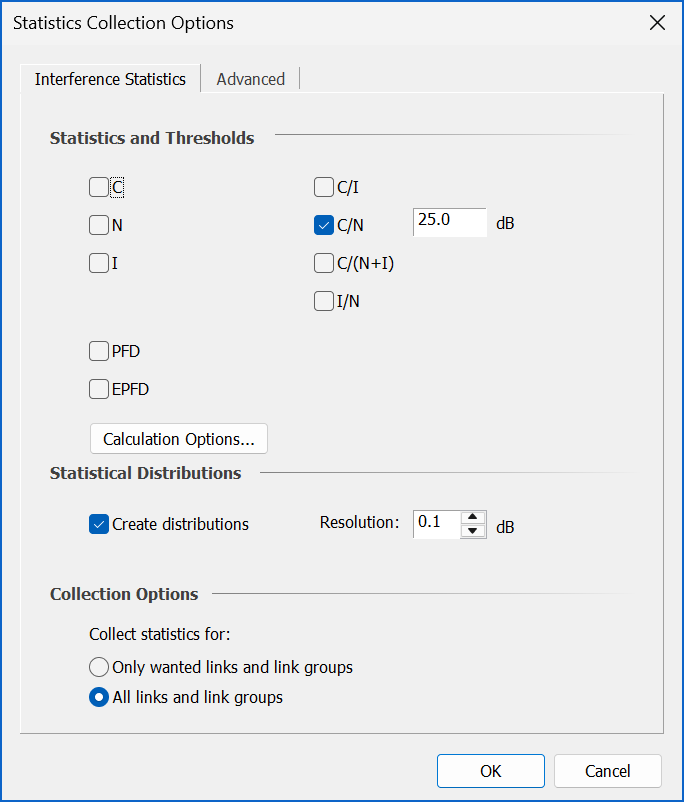
Note that the thresholds (e.g. C/N threshold) are not used in this simulation.
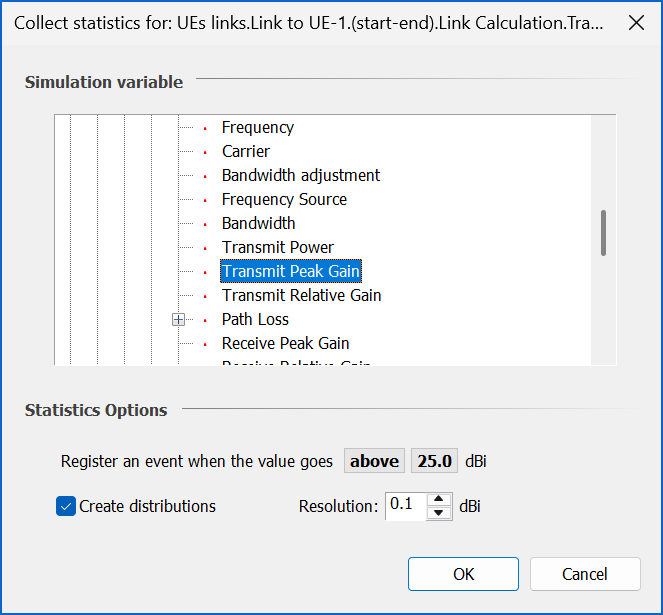
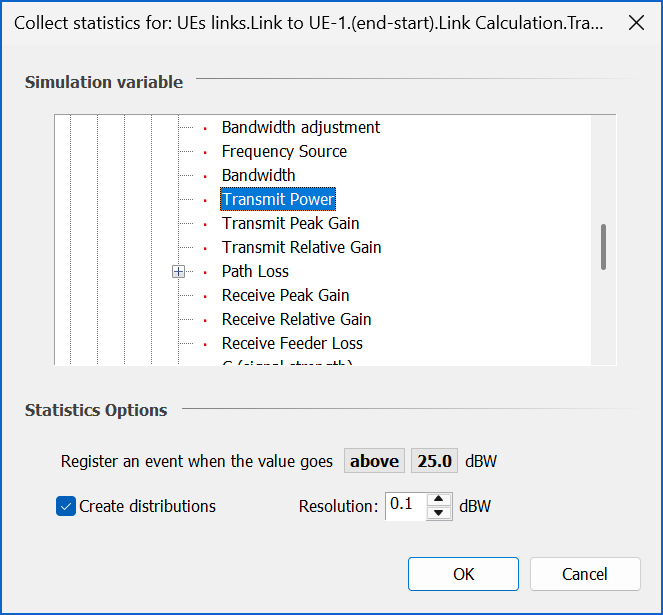
There is the ability in Visualyse Professional to gather statistics on any of the parameters in the object / variable tree with the user defined statistics. These are available under advanced and in this case are the following parameters:
- UE link 1.(start-end).Link Calculation.Transmit Power
- UE link 1.(end-start).Link Calculation.Transmit Peak Gain
Each of the three links have been configured with the same parameters so should give the same results. These could be checked by collecting further statistics if required.
With a bin size of 0.1 dB the dialogs are as below.
Checking the Simulation
An important part of building a simulation is the ability to check it has been configured correctly and the various components are working as expected.
The first step in this process is typically to look at the link budgets to make sure that all the parameters are as expected. If there are just one or two links then the best way to do this is via the watch window. If there are more links than this it is better to use a table view.
Hence open a table view, select the link group with the three 3 UE links and then the following variables:
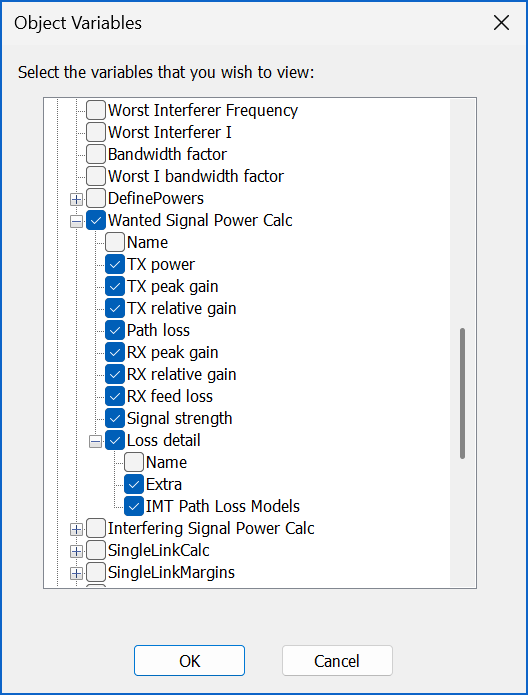
Other parameters can be selected, such as link length, frequency, bandwidth and the link budget for the return direction. The resulting table view shows these link budget parameters for the three links:
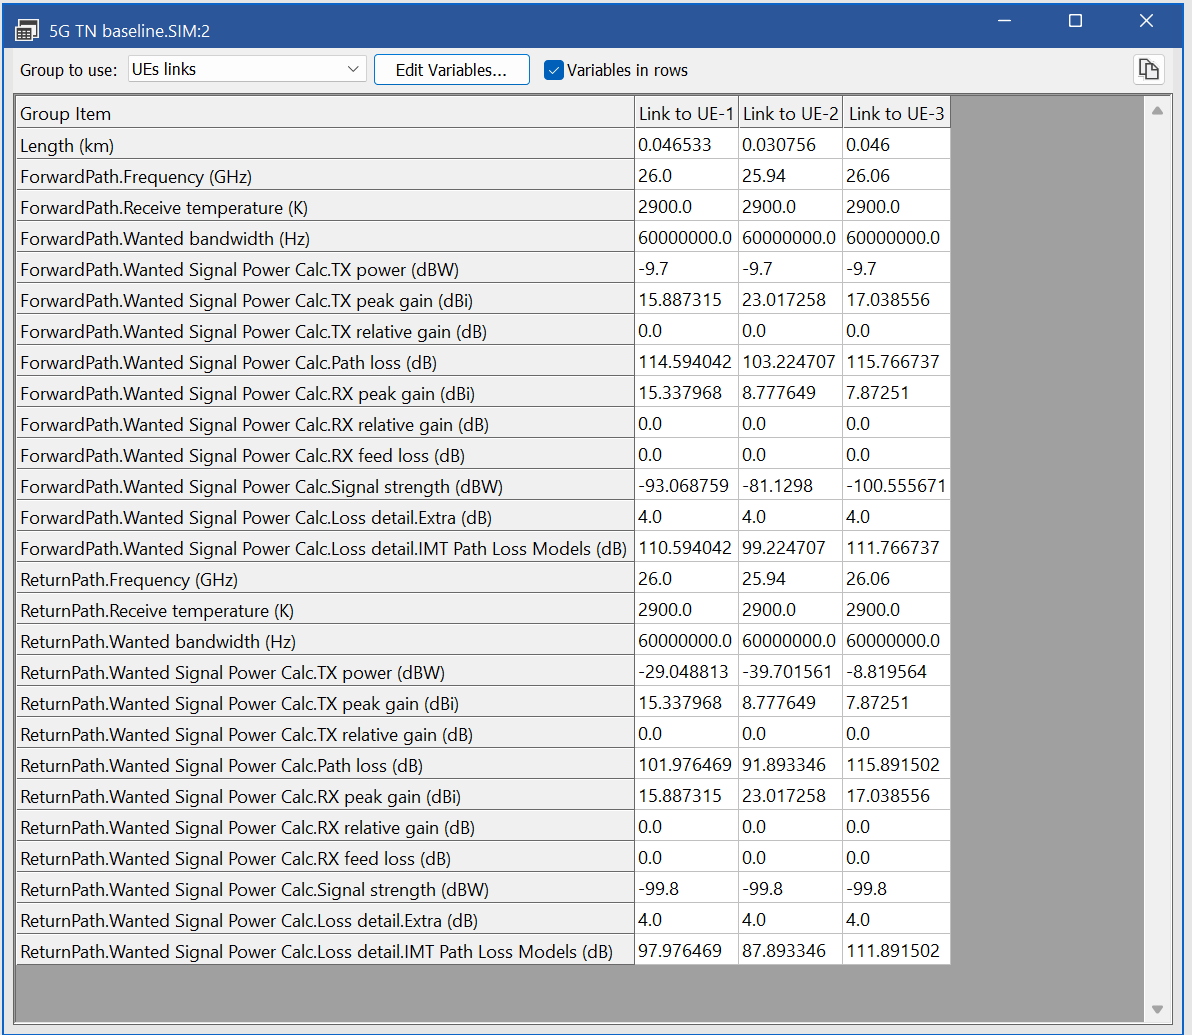
It is worth checking these numbers, for example:
- That the relative gain at the BS is zero i.e. that the beam is pointing directly at a UE
- That the path loss values look reasonable (see further analysis below)
- That the resulting C/Ns are in the expected range
- That if the simulation is stepped forward, these values update and continue to be reasonable
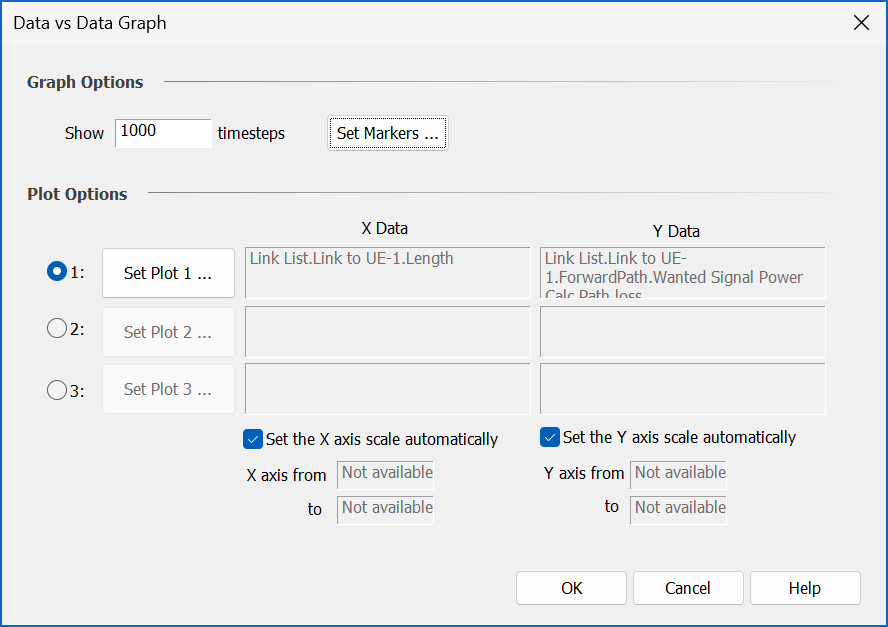
The propagation model will have a significant impact on the results and so it is useful to get a feel for the sort of values it is generating. One way to do this is to plot the path loss vs. path length using the XY graph in Visualyse Professional.
This can be done by configuring the data selection dialog to show the path loss vs. the link length for the last 1,000 steps as follows:
The resulting plot is as follows:
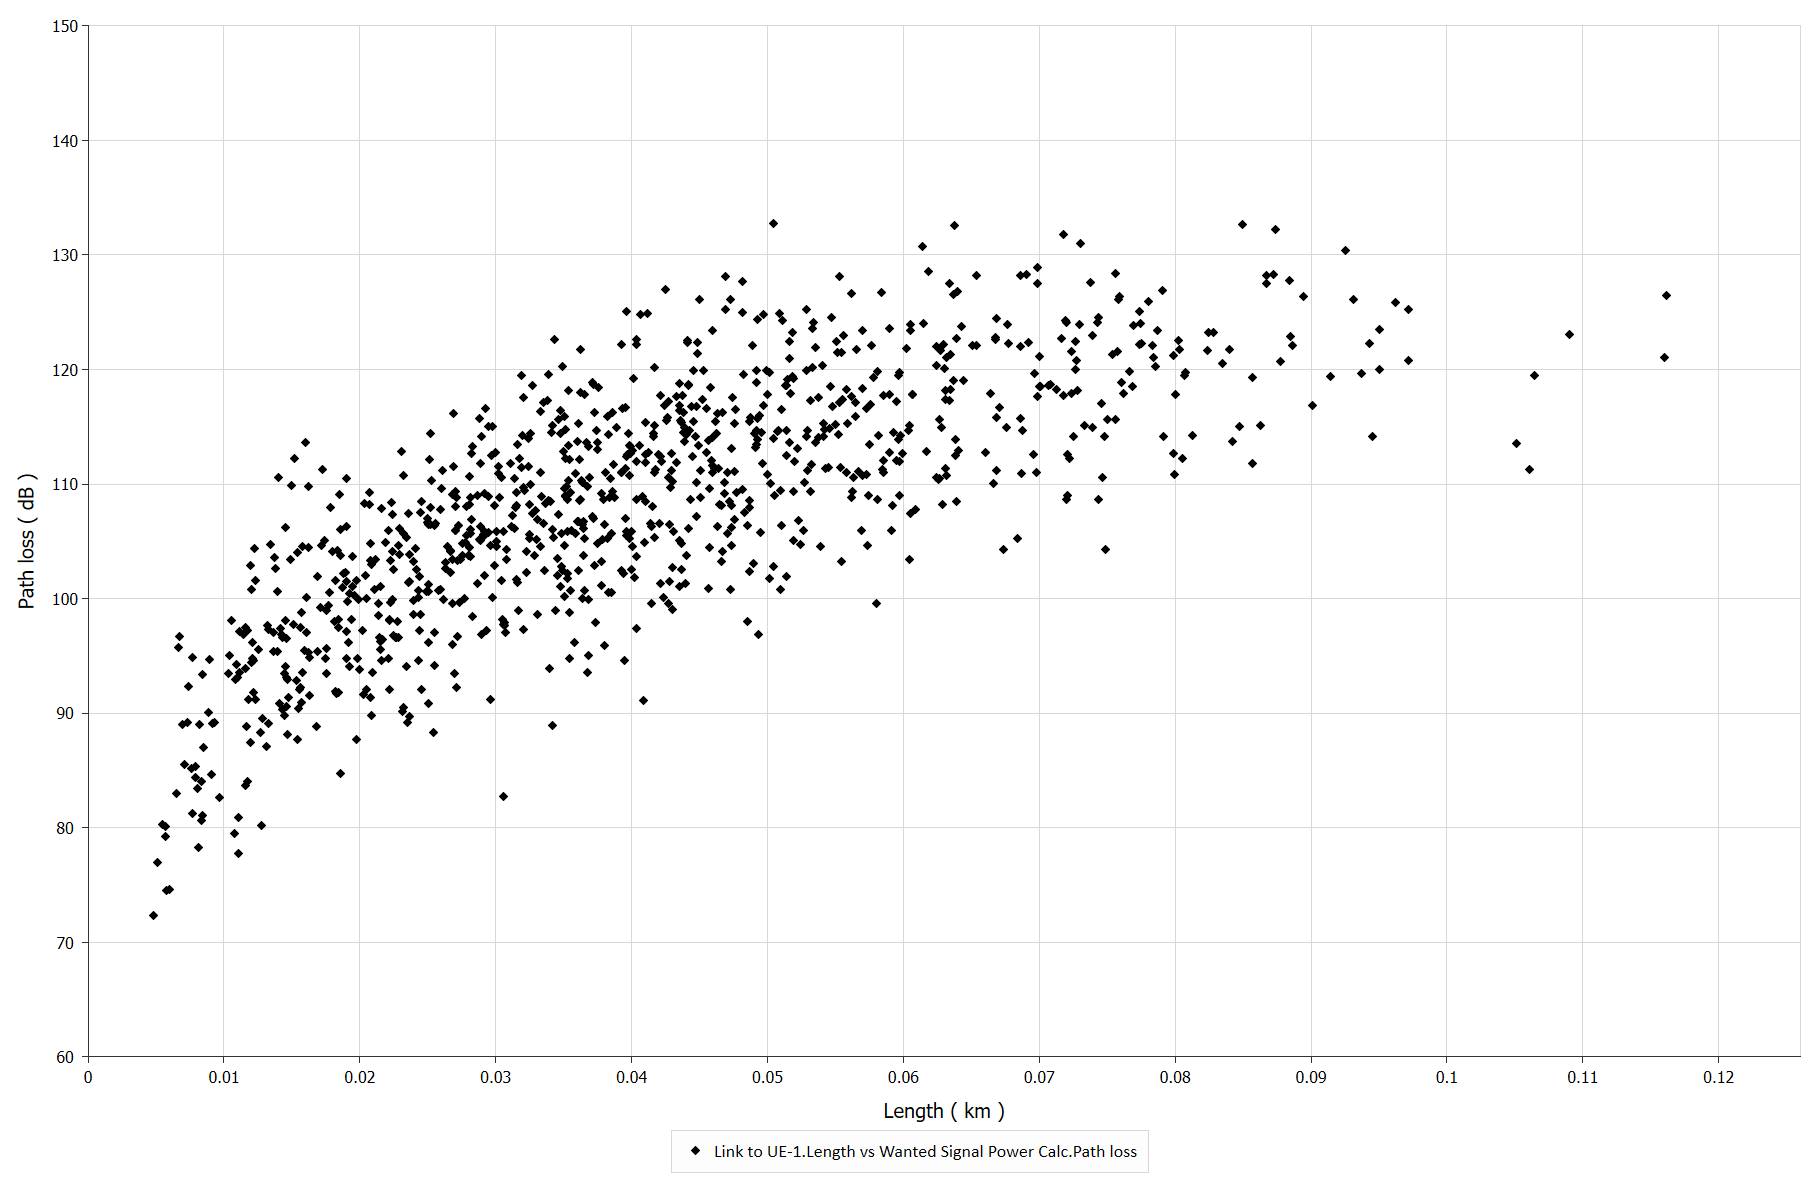
Note this chart has been changed to a scatter plot from the default of a line drawing.
It can be seen that there are multiple values of the path loss for any given distance: this is as expected given the random variation factor.
Results
The required outputs of this analysis were the CDFs of:
- Gain at the BS towards the UE
- Transmit power at the UE (single UE and 3 UE per sector cases)
- C/N of the downlink
The outputs from Visualyse Professional are shown in the figures below using the non-uniform and also a uniform deployment model.


It can be seen that there is good agreement of the uniform deployment results with those shown in the document: “Example implementation of the methodology in Recommendation ITU-R M.2101”.
However as noted previously, the non-uniform deployment has been agreed within TG 5/1 and so these results are also provided
This simulation files are available on request.
Next Steps
We are planning to produce additional TNs, such as how to create simulations involving aggregate interference from large numbers of 5G / IMT-202 cells via use of reference systems as in the screenshot below.
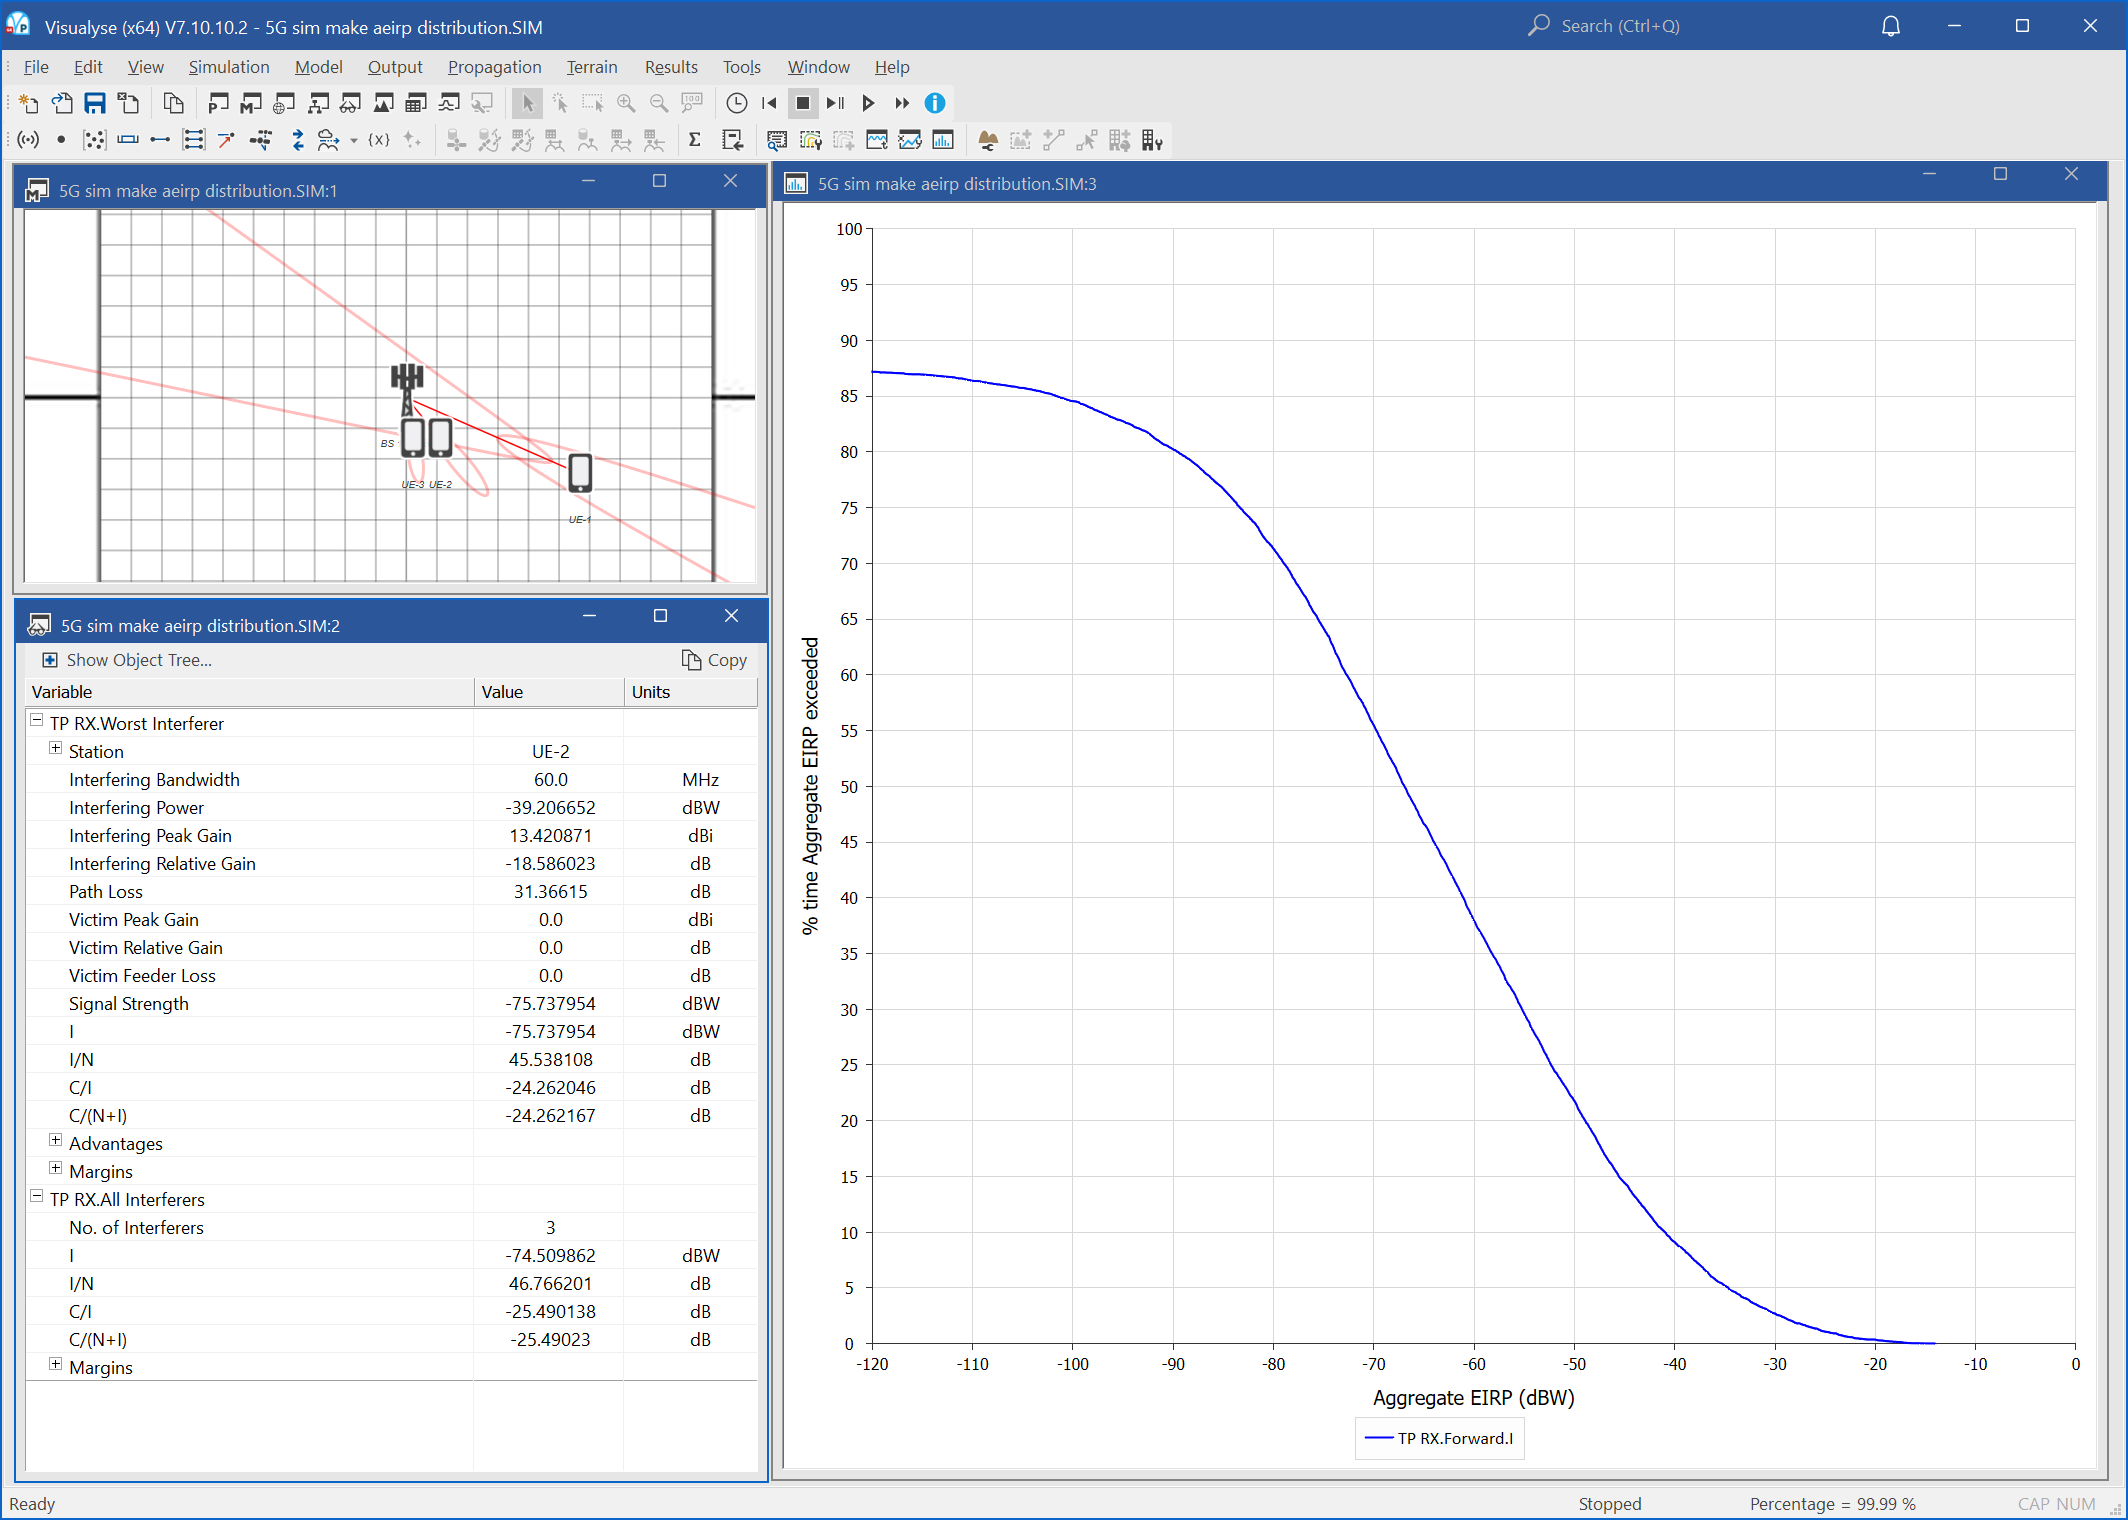
We would appreciate any feedback or suggestions you might have as to ideas or priorities.
