Abstract
Interference between radio systems can occur whether they are operating co-frequency or non-co-frequency. This Technical Note looks at how to configure Visualyse Professional carriers to model co-frequency and non-co-frequency scenarios using the standard bandwidth overlap and net filter discrimination (NFD) techniques.
Introduction
Three of the key parameters of a radio communication system are the:
= transmit power
= the centre frequency
= bandwidth of its transmissions.
In many cases, these three can be modelled as if the power density is constant in the frequency domain, so that the carrier can be represented as a rectangle, as in the figure below:

The carrier will have minimum and maximum frequency calculated using:
In reality, the carrier shape is more complicated, with peak power density in the bandwidth given but some, lower, power outside, as in this simplified figure:

Similarly, the receiver characteristics could be modelled as a rectangular filter or more complicated shape similar to that in the figure above.
If the simple rectangle approach is used, then if there is overlap between wanted and interfering bandwidths is described as co-frequency scenario. A non-co-frequency scenario is where there is no such overlap.
This Technical Note (TN) describes how to model co-frequency and non-co-frequency interference scenario in Visualyse Professional using bandwidth adjustment and the net filter discrimination (NFD).
What is the Bandwidth?
The figure in the Introduction described the width of the carrier rectangle as the “bandwidth”: what does this mean?
The Radio Regulations in 1.153 defines the occupied bandwidth as the range at which there is 0.5% of the power above the highest frequency and 0.5% of the power below the lowest frequency.
This is shown in the figure below:

If the occupied bandwidths overlap, then this 99% of power dominates the calculations. Note also that in most cases there is a sharp drop in the spectral power density at the edge of the occupied bandwidth. Hence, if there is overlap of the occupied bandwidths, it if is typically acceptable to model the carriers as rectangular blocks of spectrum with uniform spectral power density over the occupied bandwidth. This type of analysis is often called “co-frequency” analysis.
In many systems there can be multiple of these carriers stacked on slightly different frequencies, as in the figure below:

This channel bandwidth is also called the necessary bandwidth or allocated bandwidth.
In Visualyse Professional, the occupied and allocated bandwidths are specified on the Carrier object, as shown in the figure below:
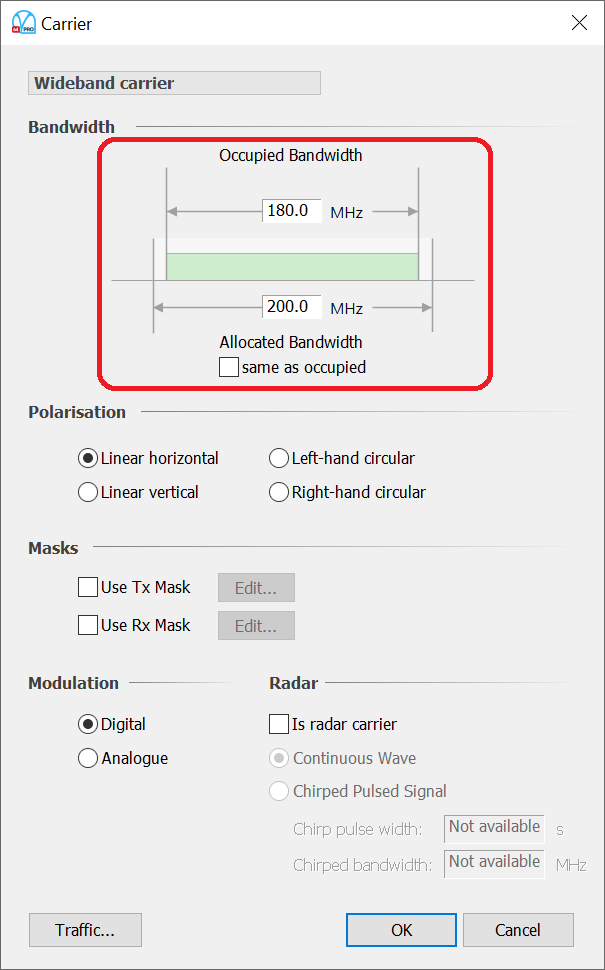
Note there is an option to set the allocated bandwidth to be the same as the occupied bandwidth. There are also options to set the Tx and Rx spectrum masks, as described further below regarding non-co-frequency analysis.
Co-Frequency Analysis
In co-frequency analysis it is typically acceptable to model the carriers using just the and the parameters. For the wanted signal calculation, it is generally assumed that the transmit spectrum mask and receive filters overlap so that there are no additional losses (or these can be added elsewhere in the calculation).
However, for the interfering paths, there can be differences in the interfering signal detected depending upon the degree of overlap between the two carriers. An example is shown in the figure below:

In this case the two carriers have equal bandwidth but are not operating exactly co-frequency. Therefore, only some of the interfering power will be detected at the receiver. The interfering signal strength will depend upon the amount of overlap. The overlap can be calculated using:
Then the overlap:
If the spectral power density is constant, then the fraction of the total interfering power at the receiver is the ratio of this overlap bandwidth with the interfering bandwidth. The interfering signal therefore must be modified by the bandwidth adjustment factor in dB units:
In Visualyse Professional, this adjustment factor can be enabled on the Interference Path object using the field shown below:
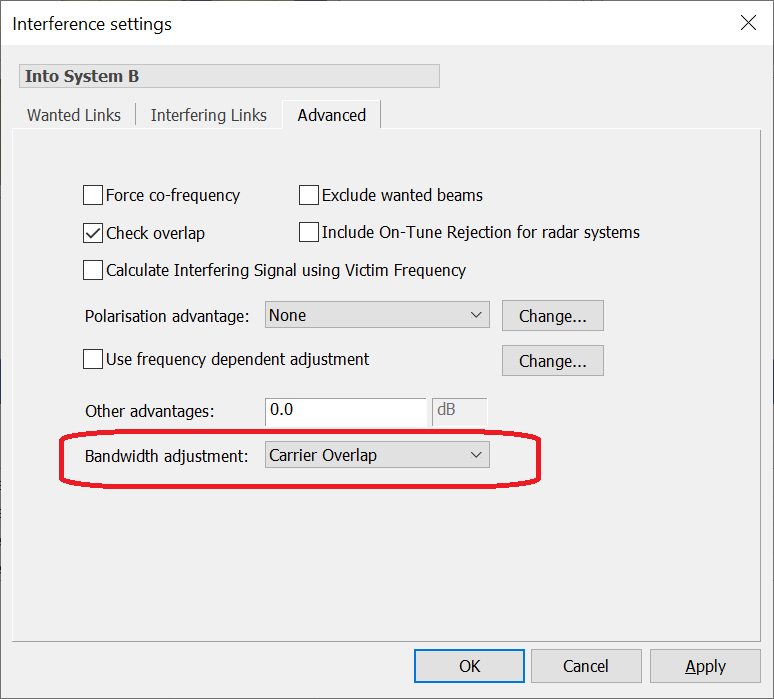
It can also be useful to enable the “Check overlap” field as this will slightly improve performance by not undertaking calculations when it is clear there is no need as there is no overlap between wanted and interfering carriers. The bandwidth adjustment factor can be seen in the Results or the Watch Window, as in this example:

Co-frequency Multiple Carriers
The example above described the case where there was one interfering carrier with roughly equal bandwidth with the victim. There can be cases where there could be large numbers of narrow-band interfering carriers in the victim bandwidth, as in the figure below:
This could be modelled in Visualyse Professional as a set of Links, each on a different frequency. However, there is another way, which is to define a single Link but specify that the bandwidth adjustment should be assuming there could be multiple interfering carriers in the victim bandwidth using the option highlighted below:
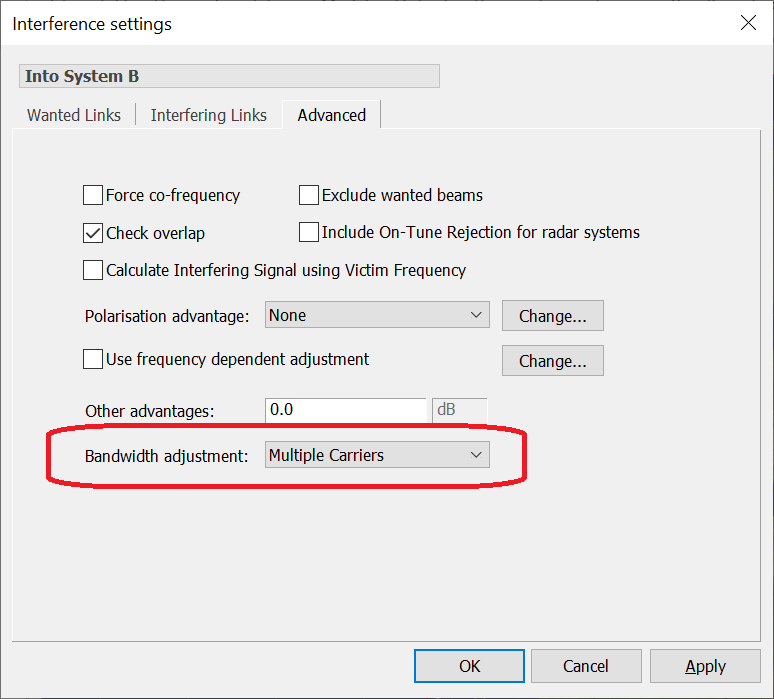
In this case, the bandwidth adjustment factor will be calculated by determining how many of the interfering carriers could be stacked up in the wanted carrier's bandwidth using:
Note that in the case of the narrow-band interferer into a wide-band victim, this factor is typically positive.
Non-Co-Frequency Analysis
An interfering signal received when non-co-frequency is typically much lower than one received co-frequency. Hence in many cases it is only necessary to calculate the co-frequency interference. However, if the interfering and victim stations are located close together, then there can be the danger of interference from non-co-frequency interferers.
For this non-co-frequency analysis, it is not sufficient to model the carriers as rectangular blocks of spectrum as there typically would be no overlap and hence no interference using the methods described above.
Non-co-frequency scenarios can be modelled in a number of different ways. The simplest is to use a single number to calculate the interference as if they were co-frequency, but then reduce the interference with an adjustment factor. This could be done via measurement or via two factors:
- ACS = adjacent channel selectivity
- ACLR = adjacent channel leakage ratio
Either of these factors could be used on their own, or the aggregate calculated, the adjacent channel interference ratio (ACIR) where (in linear or absolute):
This adjustment factor could be included in Visualyse Professional calculations using the options shown in the dialog below:
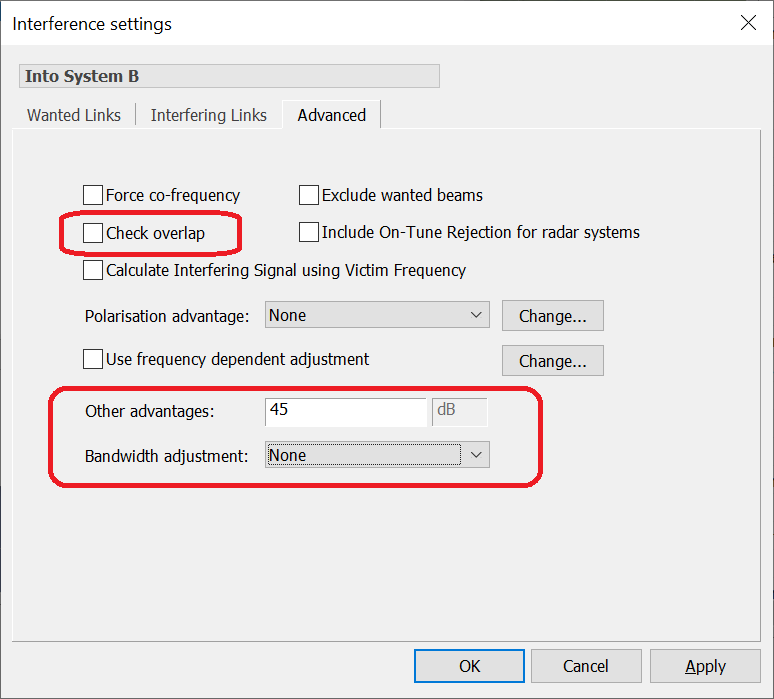
Note:
- Check overlap has been cleared so that Links that are not co-frequency are included
- Bandwidth adjustment has been set to none as the other advantages field is being used instead
- Other advantages has the ACIR in dB.
This factor can simplify analysis but relies on a static difference in centre frequencies from the channel bandwidths involved.
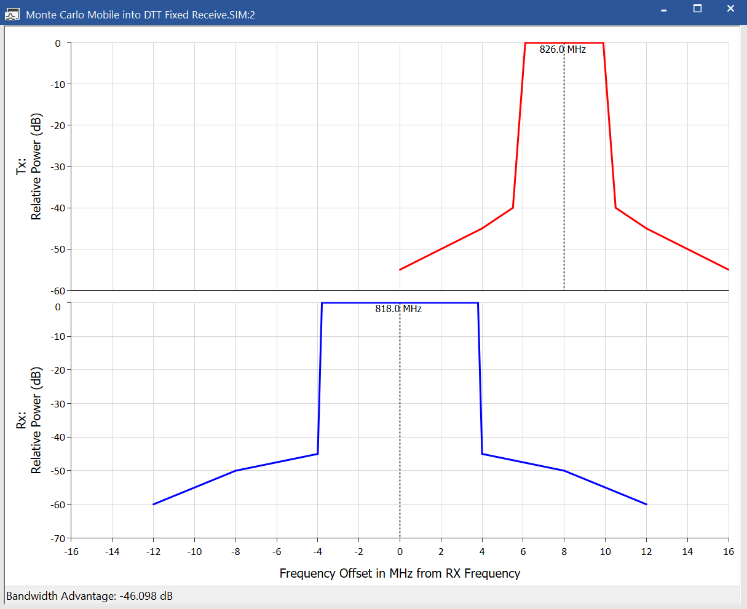
A more flexible approach calculates the adjustment factor by integrating the transmit spectrum mask with the receive filter characteristics. This is called the net filter discrimination or NFD.
The two masks are shown in the figure below:

The integration can be done using a combination of summation and integration, using terms such as:
The key step is to define the transmit spectrum mask and receive filter mask. In Visualyse Professional this is done via the Carrier object’s Tx and Rx masks, as shown below:
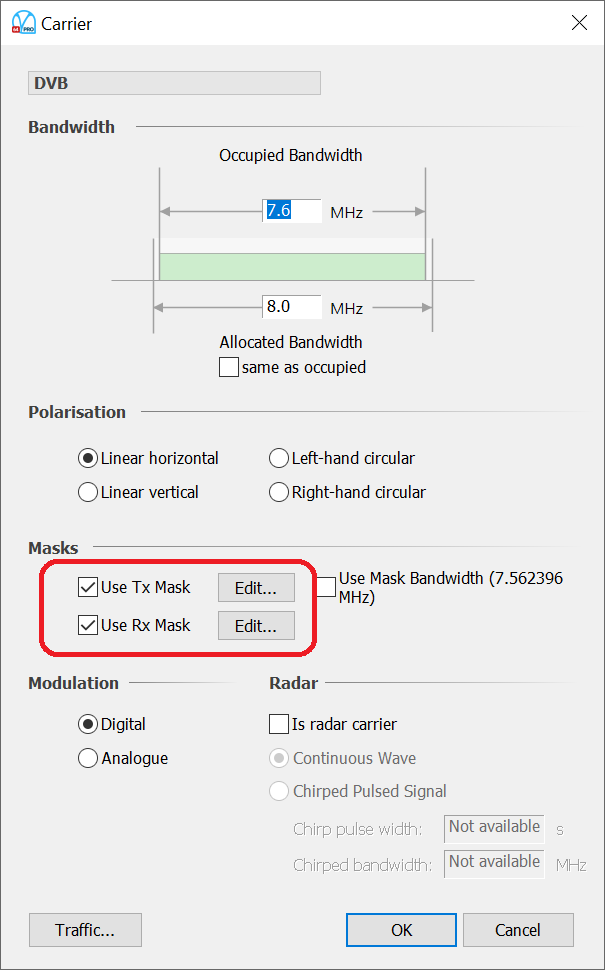
The “Edit…” button allows the table to be entered as shown below:
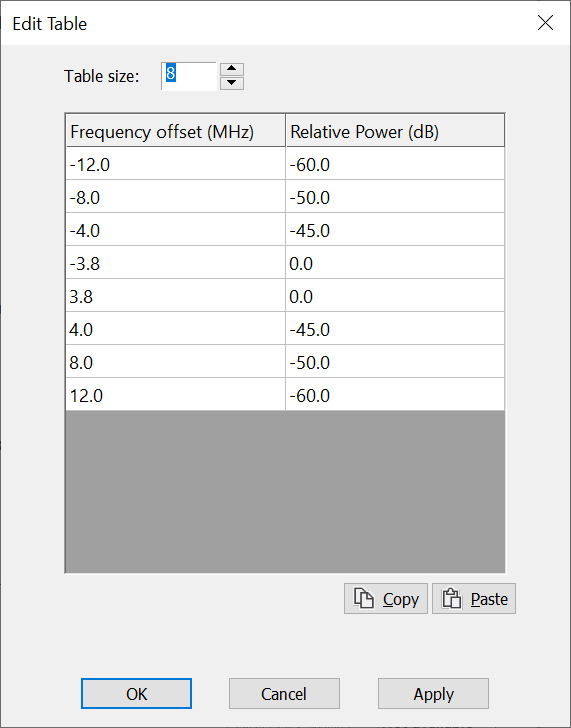
Note that the mask is not assumed to be symmetric – as some are not.
Definition of Transmit Masks
The NFD integration is undertaken over the receive filter bandwidth. So what if there is no data in the transmit mask for the all differences in frequency? Visualyse Professional will use the last valid value in the table and assume it continues indefinitely.
If you want there to be no power outside the frequency range in the transmit mask, then the last value should be very low, such as -999 dB. For the table above it could look something like this:
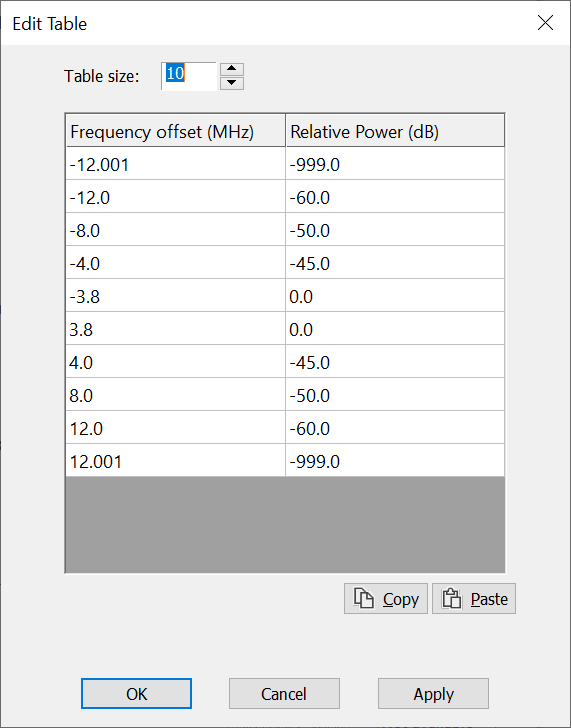
Another option could be to have a lower value, for example to reflect emissions in the spurious domain.
To active the NFD calculation, select the following parameters in the Interference Path:
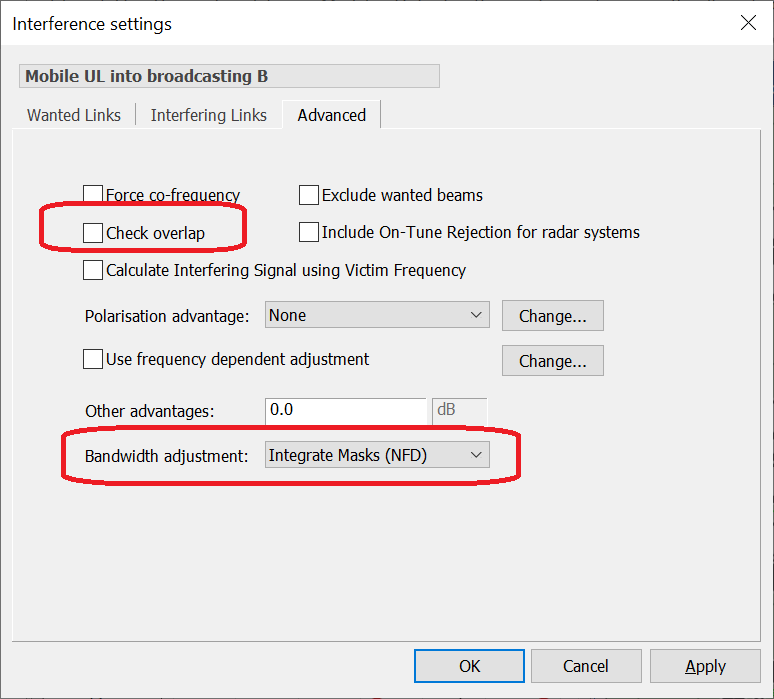
Note that:
- Check overlap has been cleared so that non-co-frequency links are included in the interference calculation
- The Bandwidth adjustment factor has been set to “Integrate Masks (NFD)”.
The NFD is shown as bandwidth adjustment factor and is also visible on the Frequency View:
Other Interference Path Options
The Interference Path dialog provides additional controls that can be used for:
- Intra-system interference
- Including on-tune rejection for pulsed carriers
- Calculating gain patterns using victim frequency
- Polarisation adjustments
If you have any questions about these fields, please contact us for more information.

