Introduction
For each link with two stations, a start and an end station, there can be two directions for a link path:
- Forward: from the start station to the end station
- Return: from the end station to the start station
In each of these directions there are choices as to how the transmit power is defined. These choices, together with the conditions that allow them to be used, are shown in the table below.
| Power method | Forward | Return |
|---|---|---|
| Fixed power level | ✓ | ✓ |
| Adaptive power control | ✓ | ✓ |
| PFD power control | ✓ | ✓ |
| Bandwidth control | ✓ | ✓ |
| Constant receive power | ✓ | ✓ |
| Random min/max entered | ✓ | ✓ |
| Random min/max from antenna type | ✓ | ✓ |
| Fixed amplification | If start station is the end station of another link | ✓ |
| Table amplification | If start station is the end station of another link | ✓ |
| Radar reflection | ✗ | If the end station antenna type is using an isotropic antenna and the same carrier is used for both directions |
| Listen before transmit | ✗ | ✓ |
Each of these options are described further below.
Note there are modes for the various power and bandwidth control options, including:
- Full, takes account of all path and propagation losses
- Path loss only, adjusts for free space path loss or spreading loss, not the other propagation losses
- Path loss and P.676, adjusts for free space path loss or spreading loss and also the gaseous attenuation in Recommendation ITU-R P.676 but not other propagation losses
- Rain fade only, adjusts for rain fades in Recommendation ITU-R P.618 only, not variations in path loss or other propagation losses.
- Alpha based, makes the adjustments according to the power control algorithm in Recommendation ITU-R M.2101. This option is only available in the power control option, not the PFD power control or bandwidth control options.
Default Scenario
Where appropriate, these power options are demonstrated with the following scenario:

A non-GSO ES is transmitting to a non-GSO satellite which is then downlinking to another non-GSO ES. This downlink could cause interference into a nearby victim non-GSO satellite and its ES.
The key parameters these systems were:
| System | Baseline | Victim |
|---|---|---|
| Satellite height (km) | 600 | 600 |
| Satellite initial longitude (deg E) | 0 | 10 |
| Uplink frequency (GHz) | 28 | - |
| Downlink frequency (GHz) | 18 | 18.00075 |
| Bandwidth (MHz) | 1 | 1 |
| Satellite antenna gain pattern | S.1528 | S.1528 |
| Satellite antenna peak gain (dBi) | 36.5 | 36.5 |
| Satellite receive temperature (K) | 300 | 300 |
| UL ES longitude (deg E) | 0 | - |
| DL ES longitude (deg E) | 5 | 10 |
| ES antenna gain pattern | M.2101 | S.1428 |
| ES antenna peak gain (dBi) (*) | 34.2 | 34.2 |
| ES receive temperature (K) | 150 | 150 |
(*) Note that the ES gain pattern of M.2101 has a peak gain that depends upon how the beam is steered compared to physical boresight and this is the maximum peak gain.
Where applicable, the system used transmit and receive masks of the interfering / victim systems were as per the figure below:
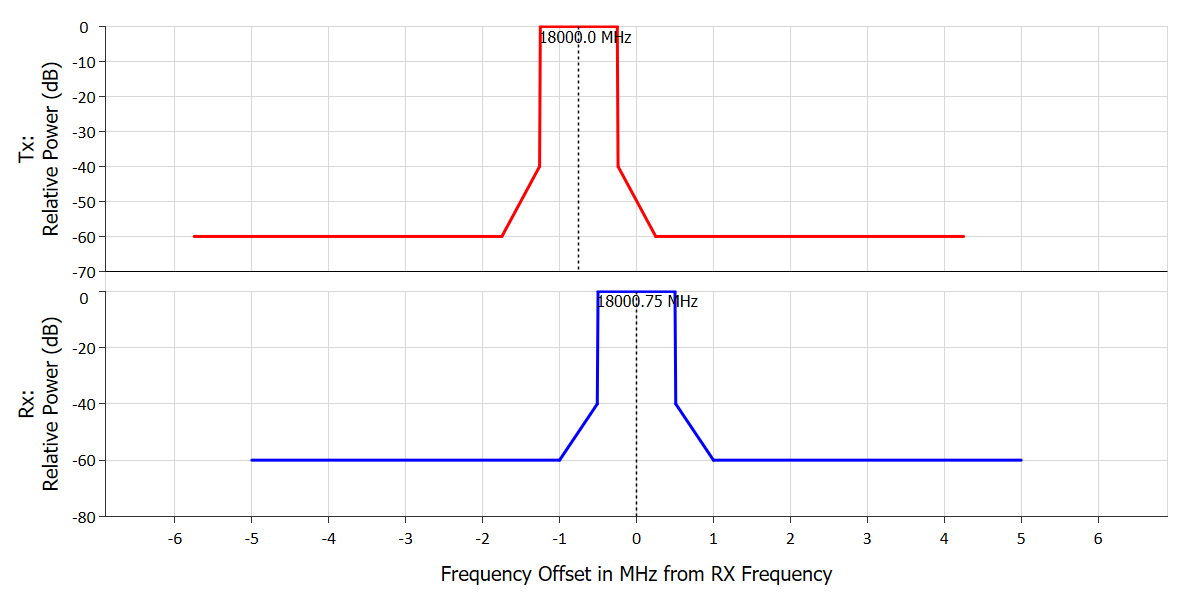
Doppler was not considered in this simulation which was run for 300time steps of 1 second duration.
The propagation models were:
- Free space path loss from Recommendation ITU-R P.525
- Gaseous attenuation calculated using Recommendation ITU-R P.676
- Rain loss calculated using Recommendation ITu-R P.618. All paths were assumed for the sake of simplicity to be full correlated i.e. the same percentage of time used for all paths at each time step.
The various losses for the non-GSO DL in the baseline runs are shown in the figure below:

The non-GSO DL ES gain varied as per the figure below:

Note that the radar reflection, listen before transmit and alpha power control simulations were customised to those scenarios.
Baseline Link Budgets
The link budget calculations are:
Where:
| Term | Description |
|---|---|
| Wanted signal | |
| Interfering signal | |
| Transmit Power | |
| Peak transmit gain with I = for the interferer | |
| Transmit gain relative to peak with I = for the interferer | |
| Total propagation losses | |
| Peak receive gain with for the victim | |
| Receive gain relative to peak with for the victim | |
| Power Flux Density | |
| Receiver noise | |
| Boltzmann's constant | |
| Receive temperature | |
| Signal bandwidth |
Fixed Power Level
Inputs
- Power = -20 dBW
The transmit and receive powers are shown in the figure below:

The receive power can be seen to reflect the changes in the propagation loss and non-GSO ES antenna peak gain.
The impact on the interference was as in the figure below:

Here:
- The transmit power is constant at -20 dBW
- The bandwidth adjustment is constant at -6 dB reflecting the partial overlap of the two carriers
- The interference varies depending upon the gains at the satellite and victim ES and various propagation losses.
Adaptive Power Control
There are five modes:
These are described further in the sub-sections below.
Adaptive Power Control: Full
The link budget is calculated as above using the minimum power and then the difference between the target and actual signal is calculated:
This is then clipped to the range:
Then is added to the transmit power and receive signal:
Inputs
- Target receive = -135 dBW
- Min power = -50
- Max power = -20
The transmit and receive powers are shown in the figure below:

The transmit power can be seen to vary depending upon the propagation loss. When there is margin, the power control algorithm can compensate for rain fades.
However, once the transmit power has reached its maximum the receive signal decreases and cannot compensate for rain fades.
The impact on the interference is shown in the figure below:

The impact of power control has been to reduce the interfering signal compared to the fixed power option for parts of the run. In general, the interfering signal is impacted by the change in the transmit power in all the cases below so they are not shown.
Adaptive Power Control: Path loss only
The link budget is calculated using the minimum power and free space path loss only, and then the difference between the target and actual signal is calculated:
This is then clipped to the range:
Then is added to the transmit power and receive signal:
Inputs
- Target receive = -135 dBW
- Min power = -50
- Max power = -20
The transmit and receive powers are shown in the figure below:

The transmit power can be seen to vary depending upon the free space path loss and does not compensate for rain fades. However, once the transmit power has reached its maximum the receive signal decreases.
There is an additional slight difference from the previous plot as the gaseous attenuation has not been included, in particular the time that the power control algorithm reaches its maximum is slightly later.
Adaptive Power Control: Path loss and P.676
The link budget is calculated using the minimum power and free space path loss with the Recommendation ITU-R P.676 gaseous attenuation, and then the difference between the target and actual signal is calculated:
This is then clipped to the range:
Then is added to the transmit power and receive signal:
Inputs
- Target receive = -135 dBW
- Min power = -50
- Max power = -20
The transmit and receive powers are shown in the figure below:

The transmit power can be seen to vary depending upon the free space path loss and does not compensate for rain fades. However, once the transmit power has reached its maximum the receive signal decreases.
There is an additional slight difference from the previous plot as the gaseous attenuation has been included and hence the time that the power control algorithm reaches its maximum is slightly earlier.
Adaptive Power Control: Rain fade only
The link budget is calculated using the minimum power and free space path loss with the Recommendation ITU-R P.676 gaseous attenuation, and then the difference between the target and actual signal is calculated:
This is then clipped to the range:
Then is added to the transmit power and receive signal:
Typically the propagation loss is comprised of a number of elements including the rain loss calculated using Recommendation ITU-R P.618.
Inputs
- Min power = -30
- Max power = -20
The transmit and receive powers are shown in the figure below:

The transmit power can be seen to increase only to adjust for rain fade events and the receive power is smooth, reflecting a combination of changes in:
- Free space path loss
- Gaseous attenuation
- Non-GSO ES peak gain.
Adaptive Power Control: M.2101 (alpha)
This implements the power control algorithm from Recommendation ITU-R M.2101.
Inputs
- Target receive = -110 dBW
- Min power = -30 dBW
- Max power = -7 dBW
- Alpha = 0.8
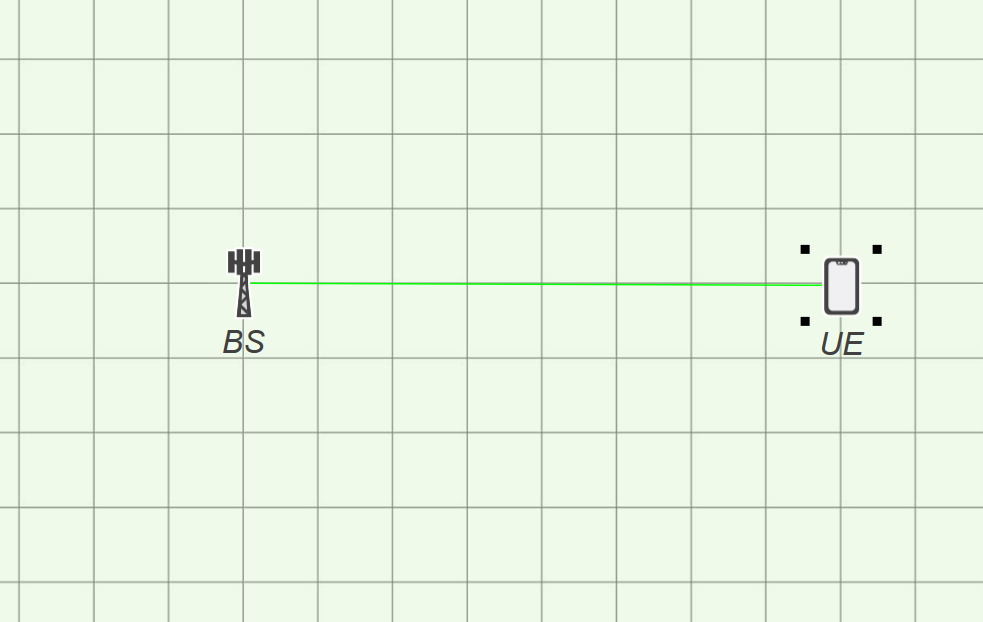
For a base station communicating to a mobile 80 m away, the power control algorithm results in a C/N = 25.8 and good link quality:
PFD Power Control
There are four modes:
These are described further in the sub-sections below.
Note the key difference from the adaptive power control is that the target threshold is PFD not received signal. As well as being a different metric, this means that changes in the receive antenna peak gain are not taken into account.
PFD Power Control: Full
The PFD is calculated using spreading loss and any other propagation models using the minimum power and then the difference between the target and actual signal is calculated:
This is then clipped to the range:
Then is added to the transmit power and receive signal:
Inputs
- Target PFD = -117 dBW/m^2/MHz
- Min power = -50
- Max power = -20
The transmit and receive powers together with the PFD are shown in the figure below:

The transmit power can be seen to vary depending upon the propagation loss. When there is margin, the power control algorithm can compensate for rain fades. However, once the transmit power has reached its maximum the receive signal decreases and cannot compensate for rain fades.
Note how the PFD on the ground remains constant for the main period while the receive signal at the non-GSO ES changes due to variations in the non-GSO ES antenna peak gain.
PFD Power Control: Path loss only
The PFD is calculated using spreading loss only using the minimum power and then the difference between the target and actual signal is calculated:
This is then clipped to the range:
Then is added to the transmit power and receive signal:
Inputs
- Target PFD = -117 dBW/m^2/MHz
- Min power = -50
- Max power = -20
The transmit and receive powers together with the PFD are shown in the figure below:

The transmit power can be seen to vary depending upon the free space path loss and does not compensate for rain fades. However, once the transmit power has reached its maximum the PFD decreases.
There is an additional slight difference from the previous plot as the gaseous attenuation has not been included, in particular the time that the power control algorithm reaches its maximum is slightly later and the PFD never reaches -117 dBW/m^2/MHz.
As before, note how the PFD on the ground remains (nearly) constant for the main period while the receive signal at the non-GSO ES changes due to variations in the non-GSO ES antenna peak gain.
PFD Power Control: Path loss and P.676
The PFD is calculated using spreading loss and gaseous attenuation in Recommendation ITu-R P.676 using the minimum power and then the difference between the target and actual signal is calculated:
This is then clipped to the range:
Then is added to the transmit power and receive signal:
Inputs
- Target PFD = -117 dBW/m^2/MHz
- Min power = -50
- Max power = -20
The transmit and receive powers are shown in the figure below:

The transmit power can be seen to vary depending upon the free space path loss and does not compensate for rain fades. However, once the transmit power has reached its maximum the receive signal decreases.
There is an additional slight difference from the previous plot as the gaseous attenuation has been included and hence the time that the power control algorithm reaches its maximum is slightly earlier.
As before, note how the PFD on the ground remains (nearly) constant for the main period while the receive signal at the non-GSO ES changes due to variations in the non-GSO ES antenna peak gain.
PFD Power Control: Rain fade only
The PFD is calculated using the minimum power using spreading loss only and then the power increased to compensate for any rain fading using Recommendation ITU-R P.618:
This is then clipped to the range:
Then is added to the transmit power and receive signal:
Inputs
- Min power = -30
- Max power = -20
The transmit and receive powers are shown in the figure below:

The transmit power can be seen to increase only to adjust for rain fade events and the receive power is smooth, reflecting a combination of changes in:
- Free space path loss
- Gaseous attenuation
- Non-GSO ES peak gain.
The PFD path is also smooth, reflecting changes in:
- Free space path loss
- Gaseous attenuation.
Bandwidth Control
The standard link budget equations are:
For bandwidth control, the bandwidth is altered rather than the transmit power, with a range from the default bandwidth to a fraction of that, , so that the new bandwidth is .
This adjustment can take account of:
These are described further in the sub-sections below.
Bandwidth Control: Full
The bandwidth ratio is calculated using the target receive power and the power calculated using the standard equation including all propagation losses:
This bandwidth ratio is then clipped to the range :
Then bandwidth is then multiplied by to derive the noise:
Inputs
- Target receive = -135 dBW
- Power = -20 dBW
- Minimum bandwidth ratio = 0.1
The bandwidth ratio and receive powers are shown in the figure below:

The bandwidth ratio is constant at 1.0 until the receive signal falls below -135 dBW at which point it decreases to try to keep the C/N constant. The impact on the C/N can be seen below compared to the C/N plot if the transmit power and bandwidth were kept constant:

The C/N can be seen to be improved compared to the fixed power and bandwidth configuration.
There is also a decrease in interference compared to the fixed power and bandwidth option, as can be seen in the figure below.

It can be seen that the interference drops to zero (Watts) at around 220 seconds. This is because the bandwidth adjustment results in no overlap at that point, as can be seen in the figure below:
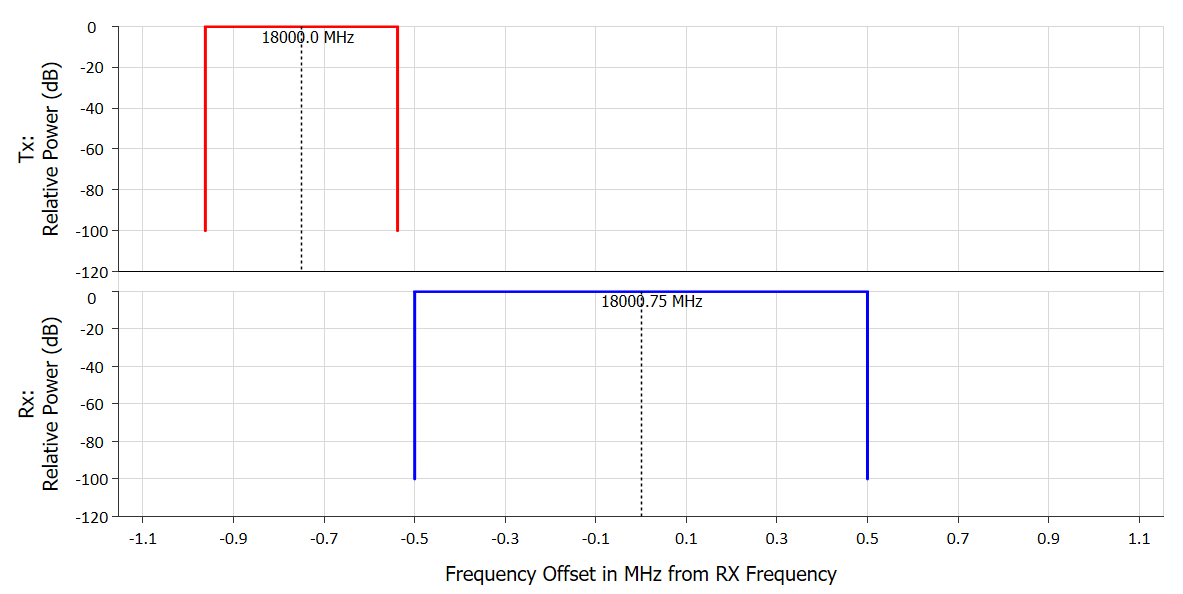
The transmit and receive systems could be modelled using masks as described in Section 2 in which case there’d continue to be interference even if there is no overlap between the occupied bandwidths.
This can be seen in the figure below where the bandwidth adjustment has been set to the calculation of the net filter discrimination (NFD):

Here it can be seen that interference continues but at a much lower level reflecting the impact of the mask integration or NFD = -46.8 dB as in the figure below:
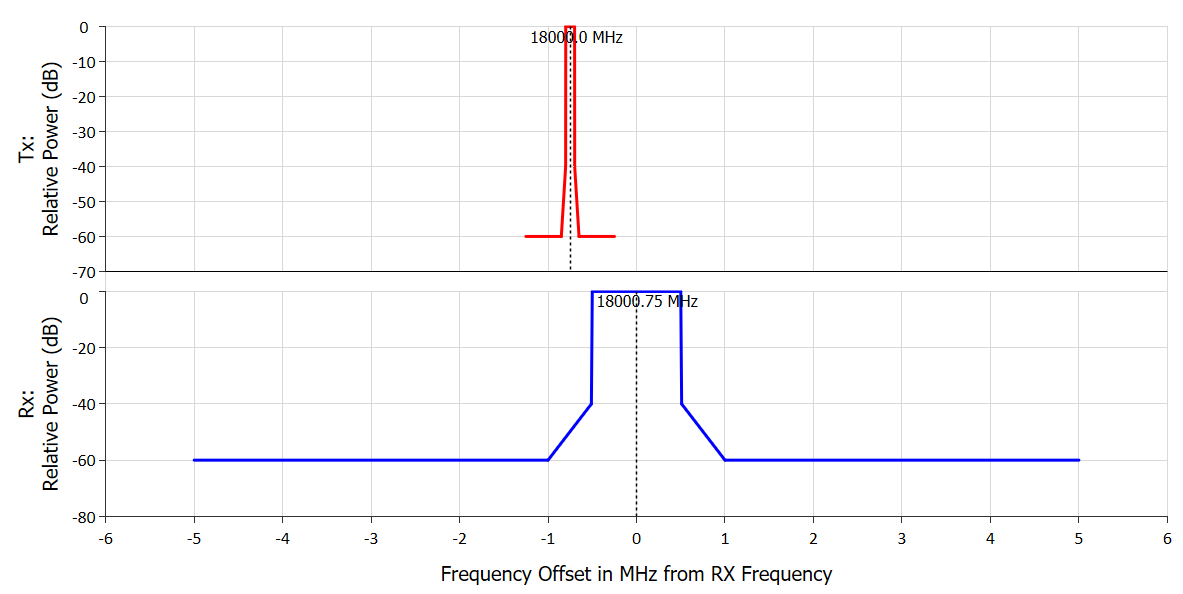
The cases below were generated using the carrier masks and NFD.
Bandwidth Control: Path loss Only
This is as for the case above but with the following equation used to calculate the C :
Inputs
- Target receive = -135 dBW
- Power = -20 dBW
- Minimum bandwidth ratio = 0.1
The bandwidth ratio and receive powers are shown in the figure below:

The plot is similar to that in the previous section but with less adjustment in the bandwidth ratio as (for example) no consideration is made as to rain fades.
Bandwidth Control: Path loss and P.676
This is as for the case above but with the following equation used to calculate the C :
Inputs
- Target receive = -135 dBW
- Power = -20 dBW
- Minimum bandwidth ratio = 0.1
The bandwidth ratio and receive powers are shown in the figure below:

The plot is similar to that in the previous section but with adjustment starting earlier as it is taking into account gaseous attenuation calculated using Recommendation ITU-R P.676 as well.
Bandwidth Control: Rain Fade Only
The bandwidth ratio is calculated from the rain fade alone:
Then bandwidth is then multiplied by to derive the noise:
Inputs
- Power = -20 dBW
- Minimum bandwidth ratio = 0.1
The bandwidth ratio and receive powers are shown in the figure below:

It can be seen that the bandwidth ratio is taking account of the rain fade only. This improves the C/N by smoothing out the rain fade drops:

Constant receive power
In this case the transmit power is only used in the interference calculation and the wanted signal is set fixed as specified.
Inputs
- Interfering power = -20 dBW
- Receive power = -135 dBW
The transmit and receive powers are shown in the figure below:

Random min/max entered
In this case the transmit power is selected at random between the minimum and maximum values entered.
Inputs
- Minimum power = -40 dBW
- Maximum power = -20 dBW
The transmit and receive powers are shown in the figure below:

The transmit power can be seen to be random in the range given, resulting in a variation in the receive signal.
Random min/max from antenna type
In this case the transmit power is calculated at random between the minimum and maximum EIRP values entered in the Antenna Type.
Inputs
- Minimum Antenna Type EIRP = 10 dBW
- Maximum Antenna Type EIRP = 30 dBW
The transmit and receive powers are shown in the figure below:

Fixed amplification
In this case the transmit power is the receive signal of the previous link plus and a constant amplification factor:
Inputs
- Amplification factor = 120 dB
The receive power on the uplink, the transmit power for the downlink and receive power of the downlink are shown in the figure below:

The transmit power can be seen to be offset from the UL receive power with consequential changes to the DL receive power.
Table amplification
In this case the transmit power is the receive signal of the previous link plus and an amplification factor that depends upon the receive signal:
This table allows the non-linear behaviour of amplifiers to be modelled.
Inputs
- Table as shown below.

The receive power on the uplink, the transmit power for the downlink and receive power of the downlink are shown in the figure below:

It can be seen that there is slightly lower transmit power at the start of the run where the receive UL single is close to the amplifier’s maximum.
Radar reflection
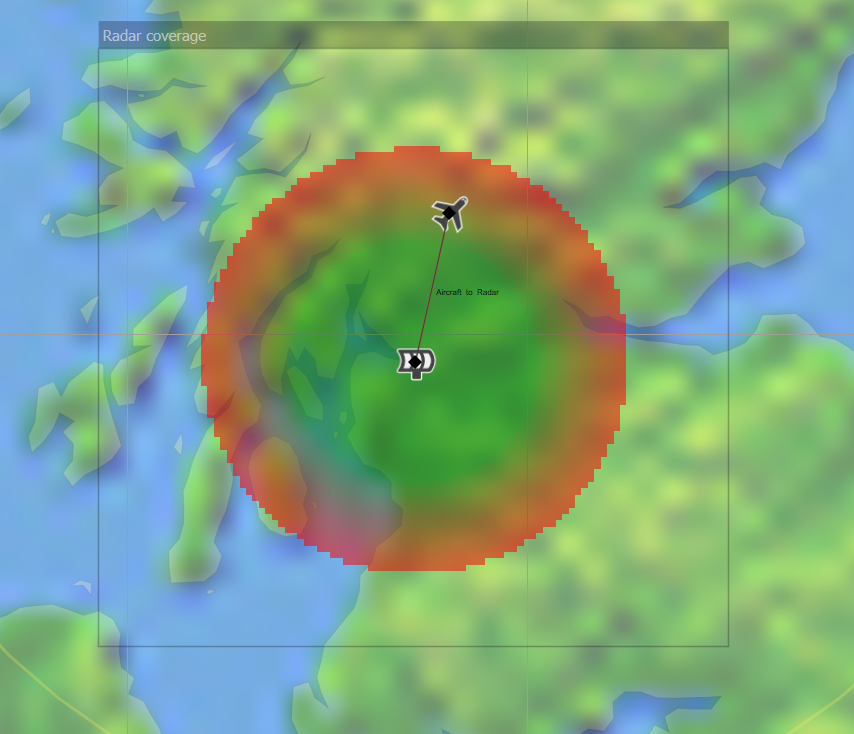
This option implements the radar equation.
Inputs
- Forward transmit power = 30 dBW
- Return cross section = 250 m^2
The resulting coverage area is shown in the figure below:
Listen before transmit
There are two listen before transmit modes:
- Instant reaction
- Defined numbers of time steps for listen or transmit states.
These are described further below.
Instant Reaction
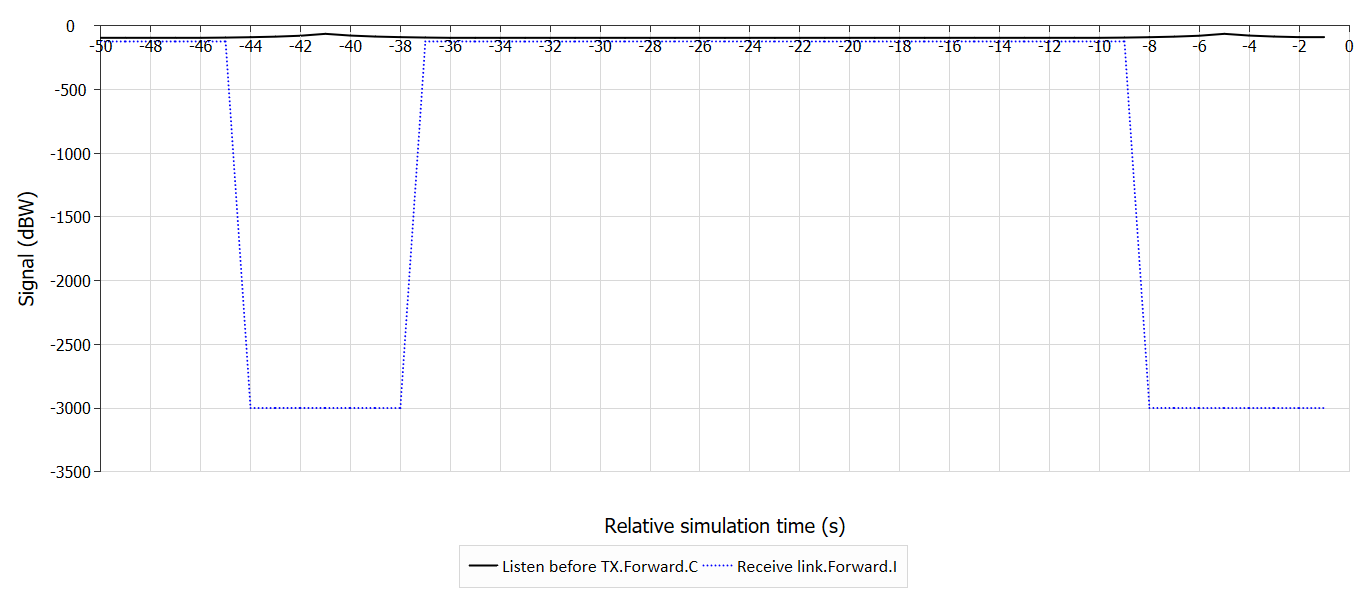
In this case the link is activated in the return direction if the forward direction signal is below a defined threshold. This happens instantly, with no delay or listen / transmit time.
Inputs
- Forward transmit power = 30 dBW
- Trigger level = -92 dBW
- Transmit power when active = -7 dBW
The link is then active for only selected periods as shown in the following plot:
Listen and Transmit Time Steps
In this case the link in the return direction is initially set to a listening state. Listening state continues until there have been time steps for which the forward direction signal is below a defined threshold. If at any of these time steps, the forward direction is above the threshold, then the counter re-sets to zero and continues until there have been time steps for which the forward direction signal is below a defined threshold.
At the end of the listening state, the link is active for time steps and then enters listening state again.
Inputs
- Forward transmit power = 30 dBW
- Trigger level = -92 dBW
- Transmit power when active = -7 dBW
- Number of listening time steps = 10
- Number of active time steps = 10
