
3
May
Abstract
Recent updates to Visualyse Professional and Visualyse Interplanetary have included a number of features that could be used to undertake studies of Radionavigation Satellite Service (RNSS) systems. This includes the ability to undertake analysis using the methodology in Recommendation ITU-R M.1642 to calculate the equivalent power flux density into Aeronautical Radionavigation Service (ARNS) receivers. In addition, the update includes the ability to calculate the geometric dilution of precision (GDOP), a useful metric for RNSS systems. These updates are described further in this Technical Note.
Introduction
RNSS systems such as GPS, Galileo, Glonass and Compass that provide positioning, navigation and timing (PNT) services have become an essential part of the national and global infrastructure. These systems rely on the receivers having ubiquitous and continual access to their radio signals without suffering harmful interference. This has required studies, at the ITU and regional organisations such as CEPT, of the potential for harmful interference into RNSS victim receivers from interfering systems. For example:
- Within CEPT, there were studies of the potential for interference from program making and special events (PMSE) transmitters in the 960 – 1 164 MHz band into RNSS receivers operating above 1 164 MHz
- Within the ITU-R, there was WRC-23 Agenda Item 9.1b, which considered a review of the amateur service and amateur-satellite service operating in 1 240 – 1 300 MHz to protect RNSS in this band.
These types of studies have already been undertaken using the Visualyse tools Visualyse Professional or Visualyse Interplanetary. However, there are additional types of studies related to RNSS that can now be undertaken using recent updates to the Visualyse tools following the inclusion of some new features. In particular, recent updates now allow the following types of analysis to be undertaken:
- Resolution 609 studies using the methodology in Recommendation ITU-R M.1642
- Analysis of the geometric dilution of precision (GDOP) as part of constellation design.
These are discussed further in this Technical Note (TN).
Resolution 609 Studies
One of the key frequency ranges used by RNSS systems is the 1 164 – 1 215 MHz band, but this is shared with the Aeronautical Radionavigation Service (ARNS). In order to protect the ARNS from harmful interference, an equivalent power flux density (epfd) threshold has been defined:
Aggregate epfd -121 dBW/m^2 in any 1 MHz
This is an aggregate epfd threshold over all RNSS systems, calculated at any location in (latitude, longitude) and in any 1 MHz bandwidth within that frequency range. Relevant ITU-R documents that are available to check whether this limit is complied with include:
- Recommendation ITU-R M.1642 contains a methodology to calculate the epfd at an ARNS receiver from any single RNSS system
- Resolution 609 defines a consultation meeting process by which the epfd values from each RNSS system are aggregated and where steps are taken, if necessary, to ensure that the aggregate epfd threshold is not exceeded.
Each RNSS system planning to operate within the frequency bands covered by Resolution 609 must submit information about their system, including:
- Satellite orbit parameters (longitude for GSO systems, constellation orbital elements for non-GSO systems)
- Maximum PFD vs. elevation angle
- Spectrum adjustment factor for the system
- Aggregate EPFD calculation for the worst 1 MHz by latitude and longitude.
This requires the RNSS operator to undertake analysis, such as:
- To derive the maximum PFD vs. elevation angle
- To use the PFD vs. elevation angle and orbit parameters to determine the maximum aggregate epfd and how it varies across the surface of the Earth, using the methodology in Recommendation ITU-R M.1642.
The next section describes how these studies can be undertaken using Visualyse tools.
Analysis in Visualyse Tools
Calculation of PFD vs Elevation Angle
Visualyse can be used to calculate PFD vs. the elevation angle at which it is being received. One way to do this is shown in the simulation file shown in the figure below:
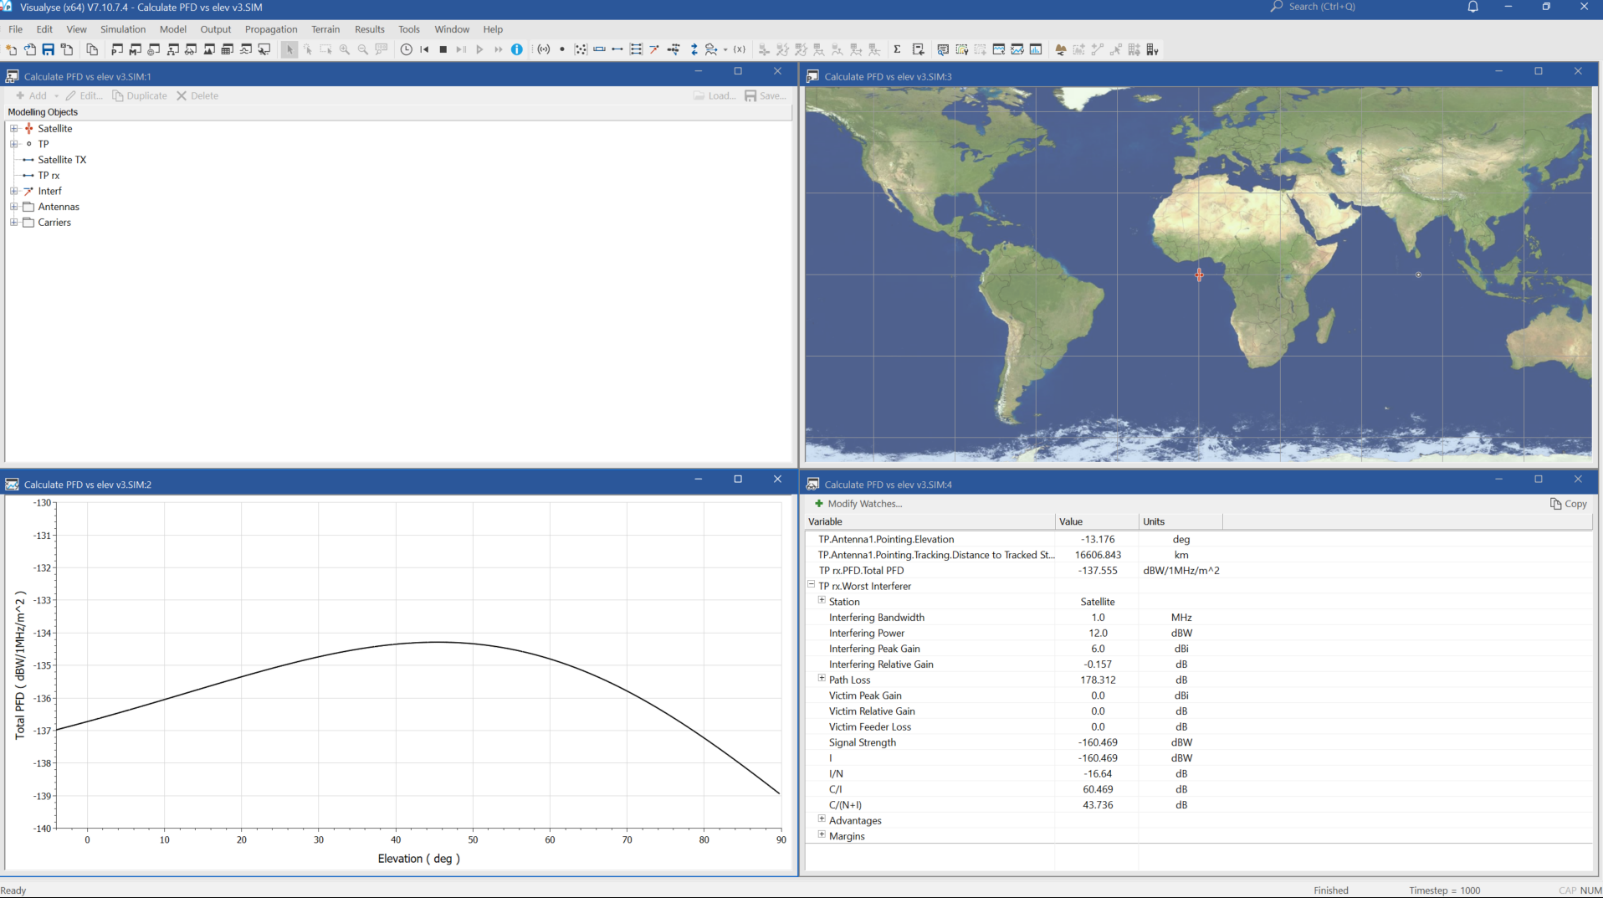
The PFD is measured at a test point that is located at the height of the ARNS receiver, namely 12.192 km. It is moved from the sub-satellite point to the edge of visibility, which for this height means the minimum elevation angle goes down to -4. The satellite is modelled via the following parameters:
- Altitude (km)
- Gain pattern
- Maximum power in 1 MHz (dBW).
The plot shows the resulting PFD vs elevation angle. This data can also be logged to a text file and then converted into the format required for a Resolution 609 input.
Calculation of EPFD using Recommendation ITU-R M.1642 Methodology
The methodology in Recommendation ITU-R M.1642 involves calculating the maximum epfd into an ARNS receiver over:
- Time: to model the variation in epfd at any specific location as the satellites moves through their orbit
- Location: to model the variation in epfd in latitude and longitude using a 1 grid of test points.
For non-GSO constellations with non-repeating orbits, after sufficient samples in time, the maximum epfd should be invariant in longitude and only vary in latitude, and be symmetric north and south of the equator. With a sufficiently long run and fine time steps, it can, therefore, be acceptable to calculate the maximum epfd for a set of latitudes = {0, 1, 2… 90}.
As well as time dynamic methodologies, it can also be helpful to undertake a Monte Carlo simulation, in which the non-GSO satellite constellation is randomized in a way that is consistent with long-term orbit shell density. Note that in Visualyse the orbit parameters can be read in directly from the ITU’s SRS database.
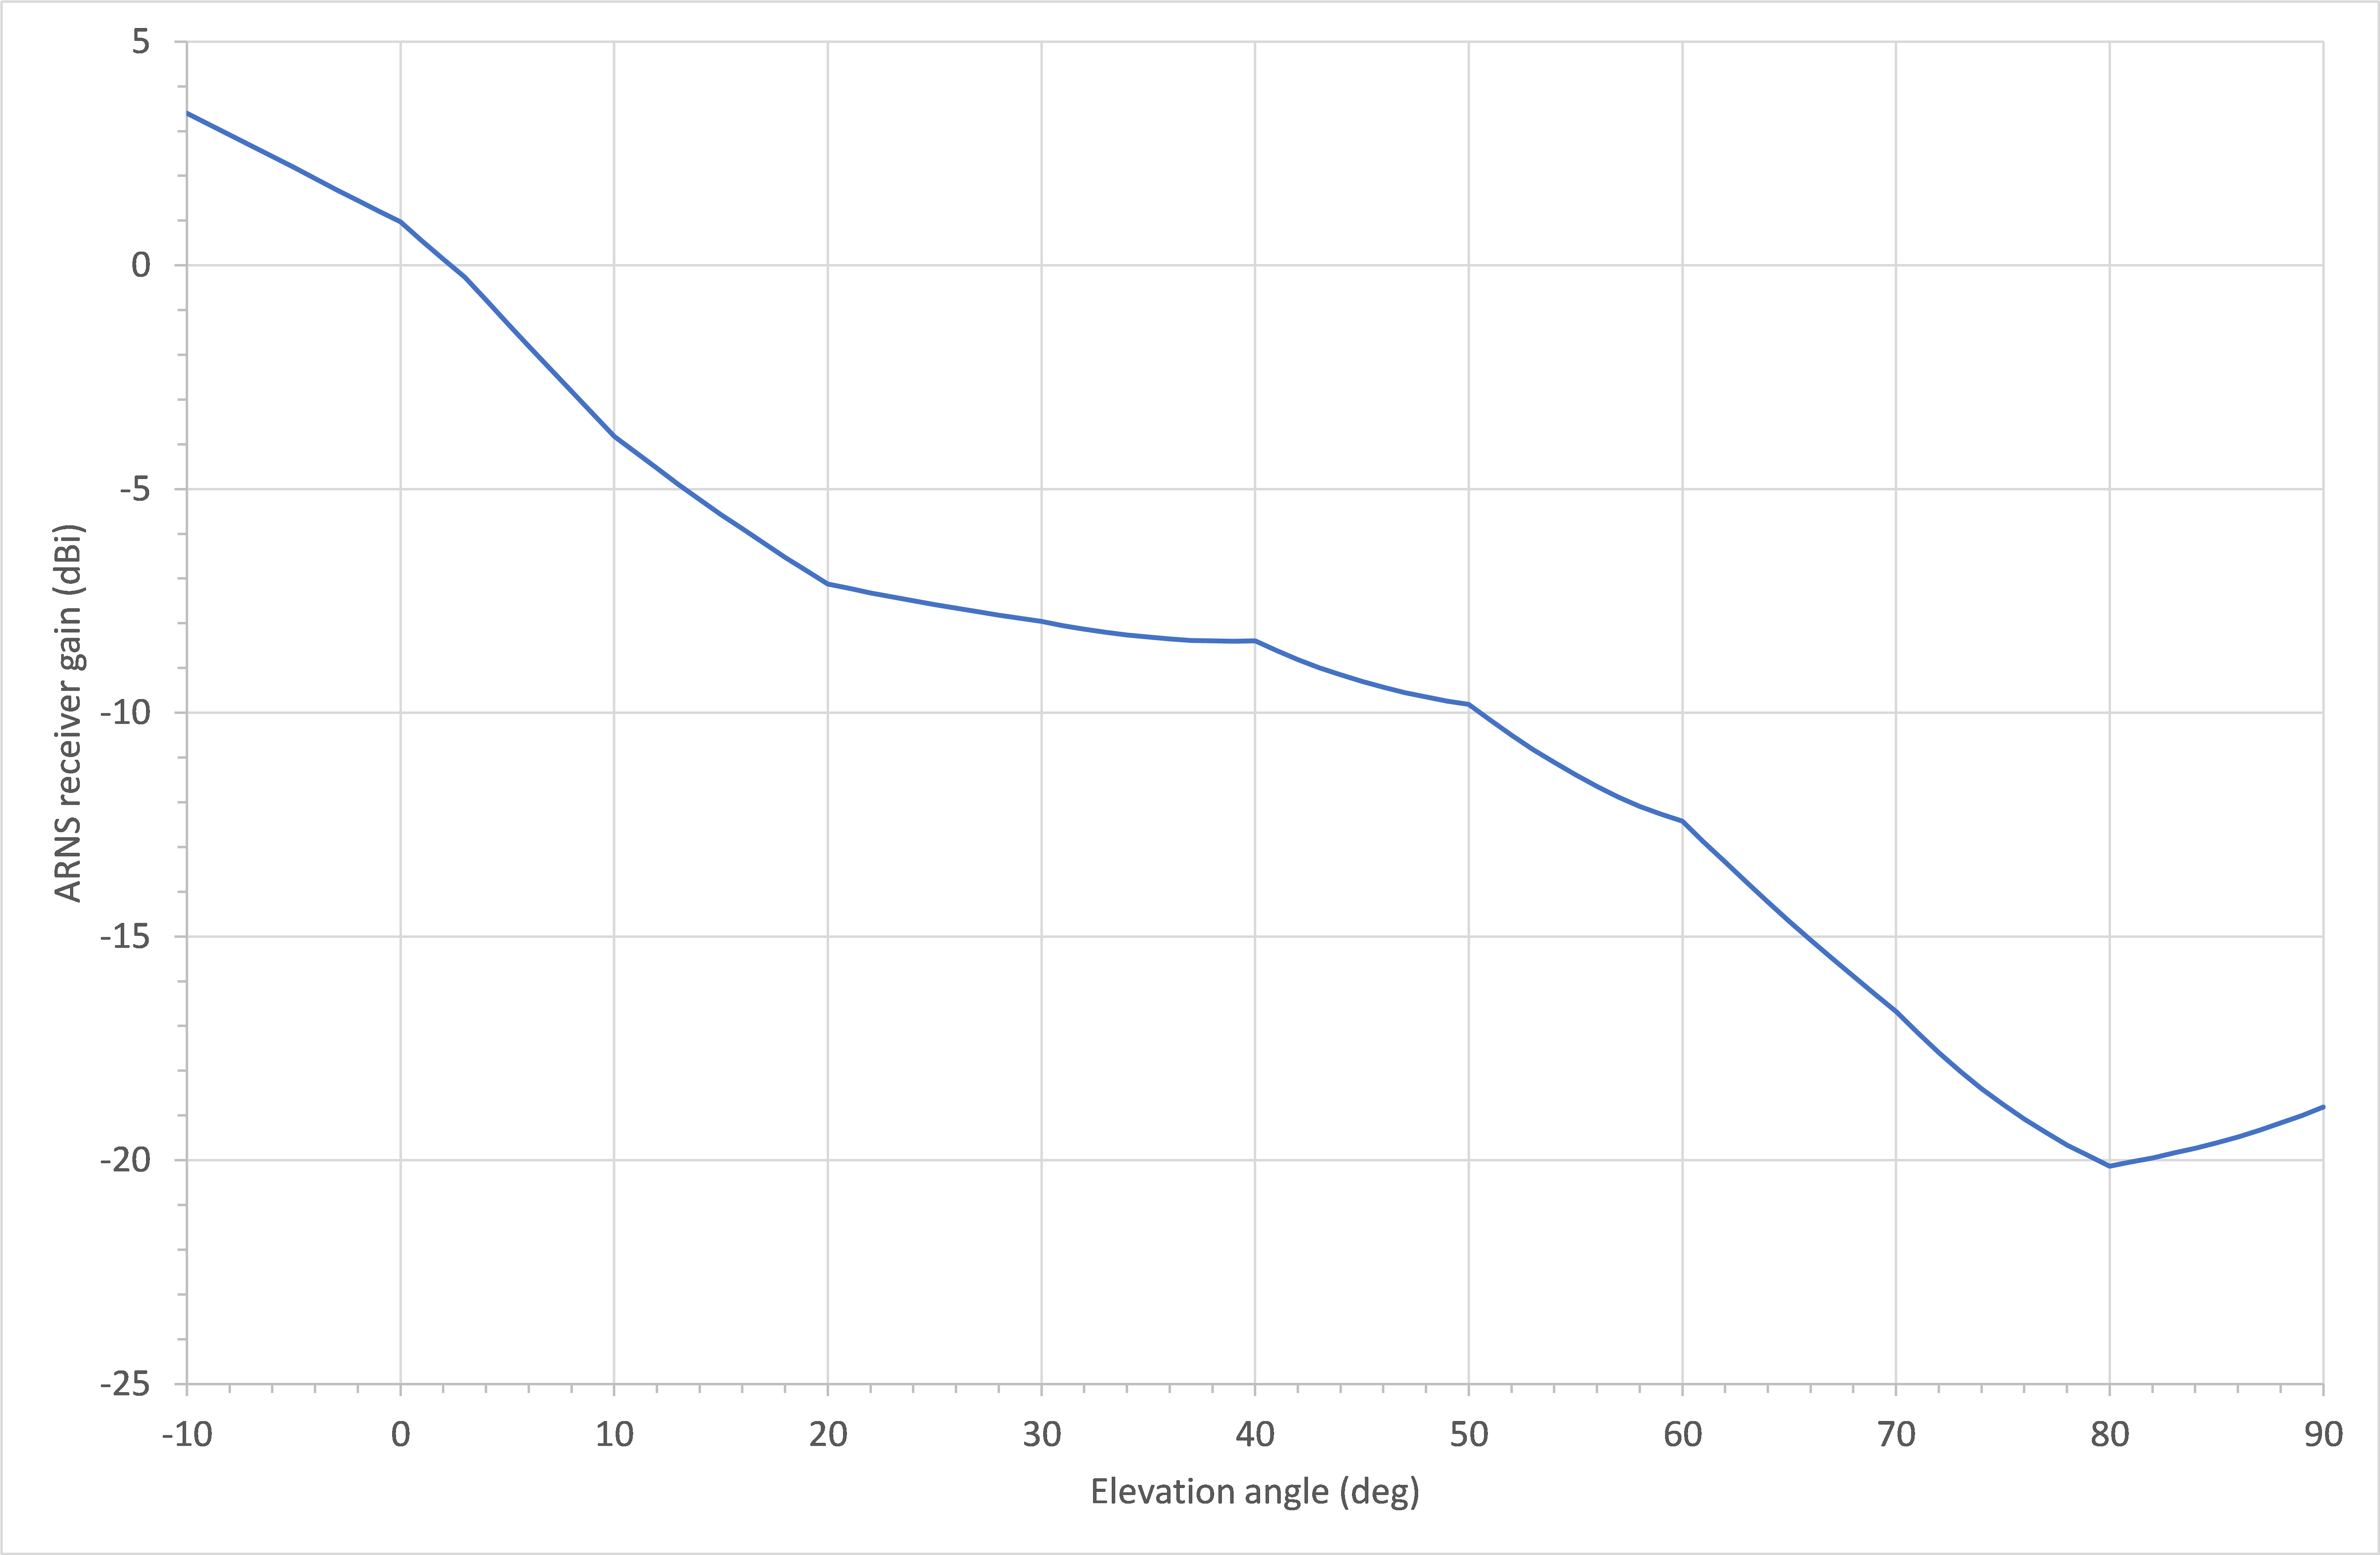
The ARNS receiver is modelled at a height of 12.192 km and gain pattern as per the table in Recommendation ITU-R M.1642 as shown below:
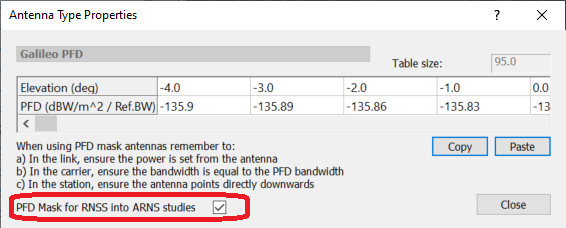
A new feature in Visualyse tools allows the PFD mask to be defined at the ARNS height as shown in the figure below:
Example Analysis using Galileo
An example analysis was undertaken using the PFD mask provided to the Resolution 609 process for the Galileo satellite network as shown in the figure below:
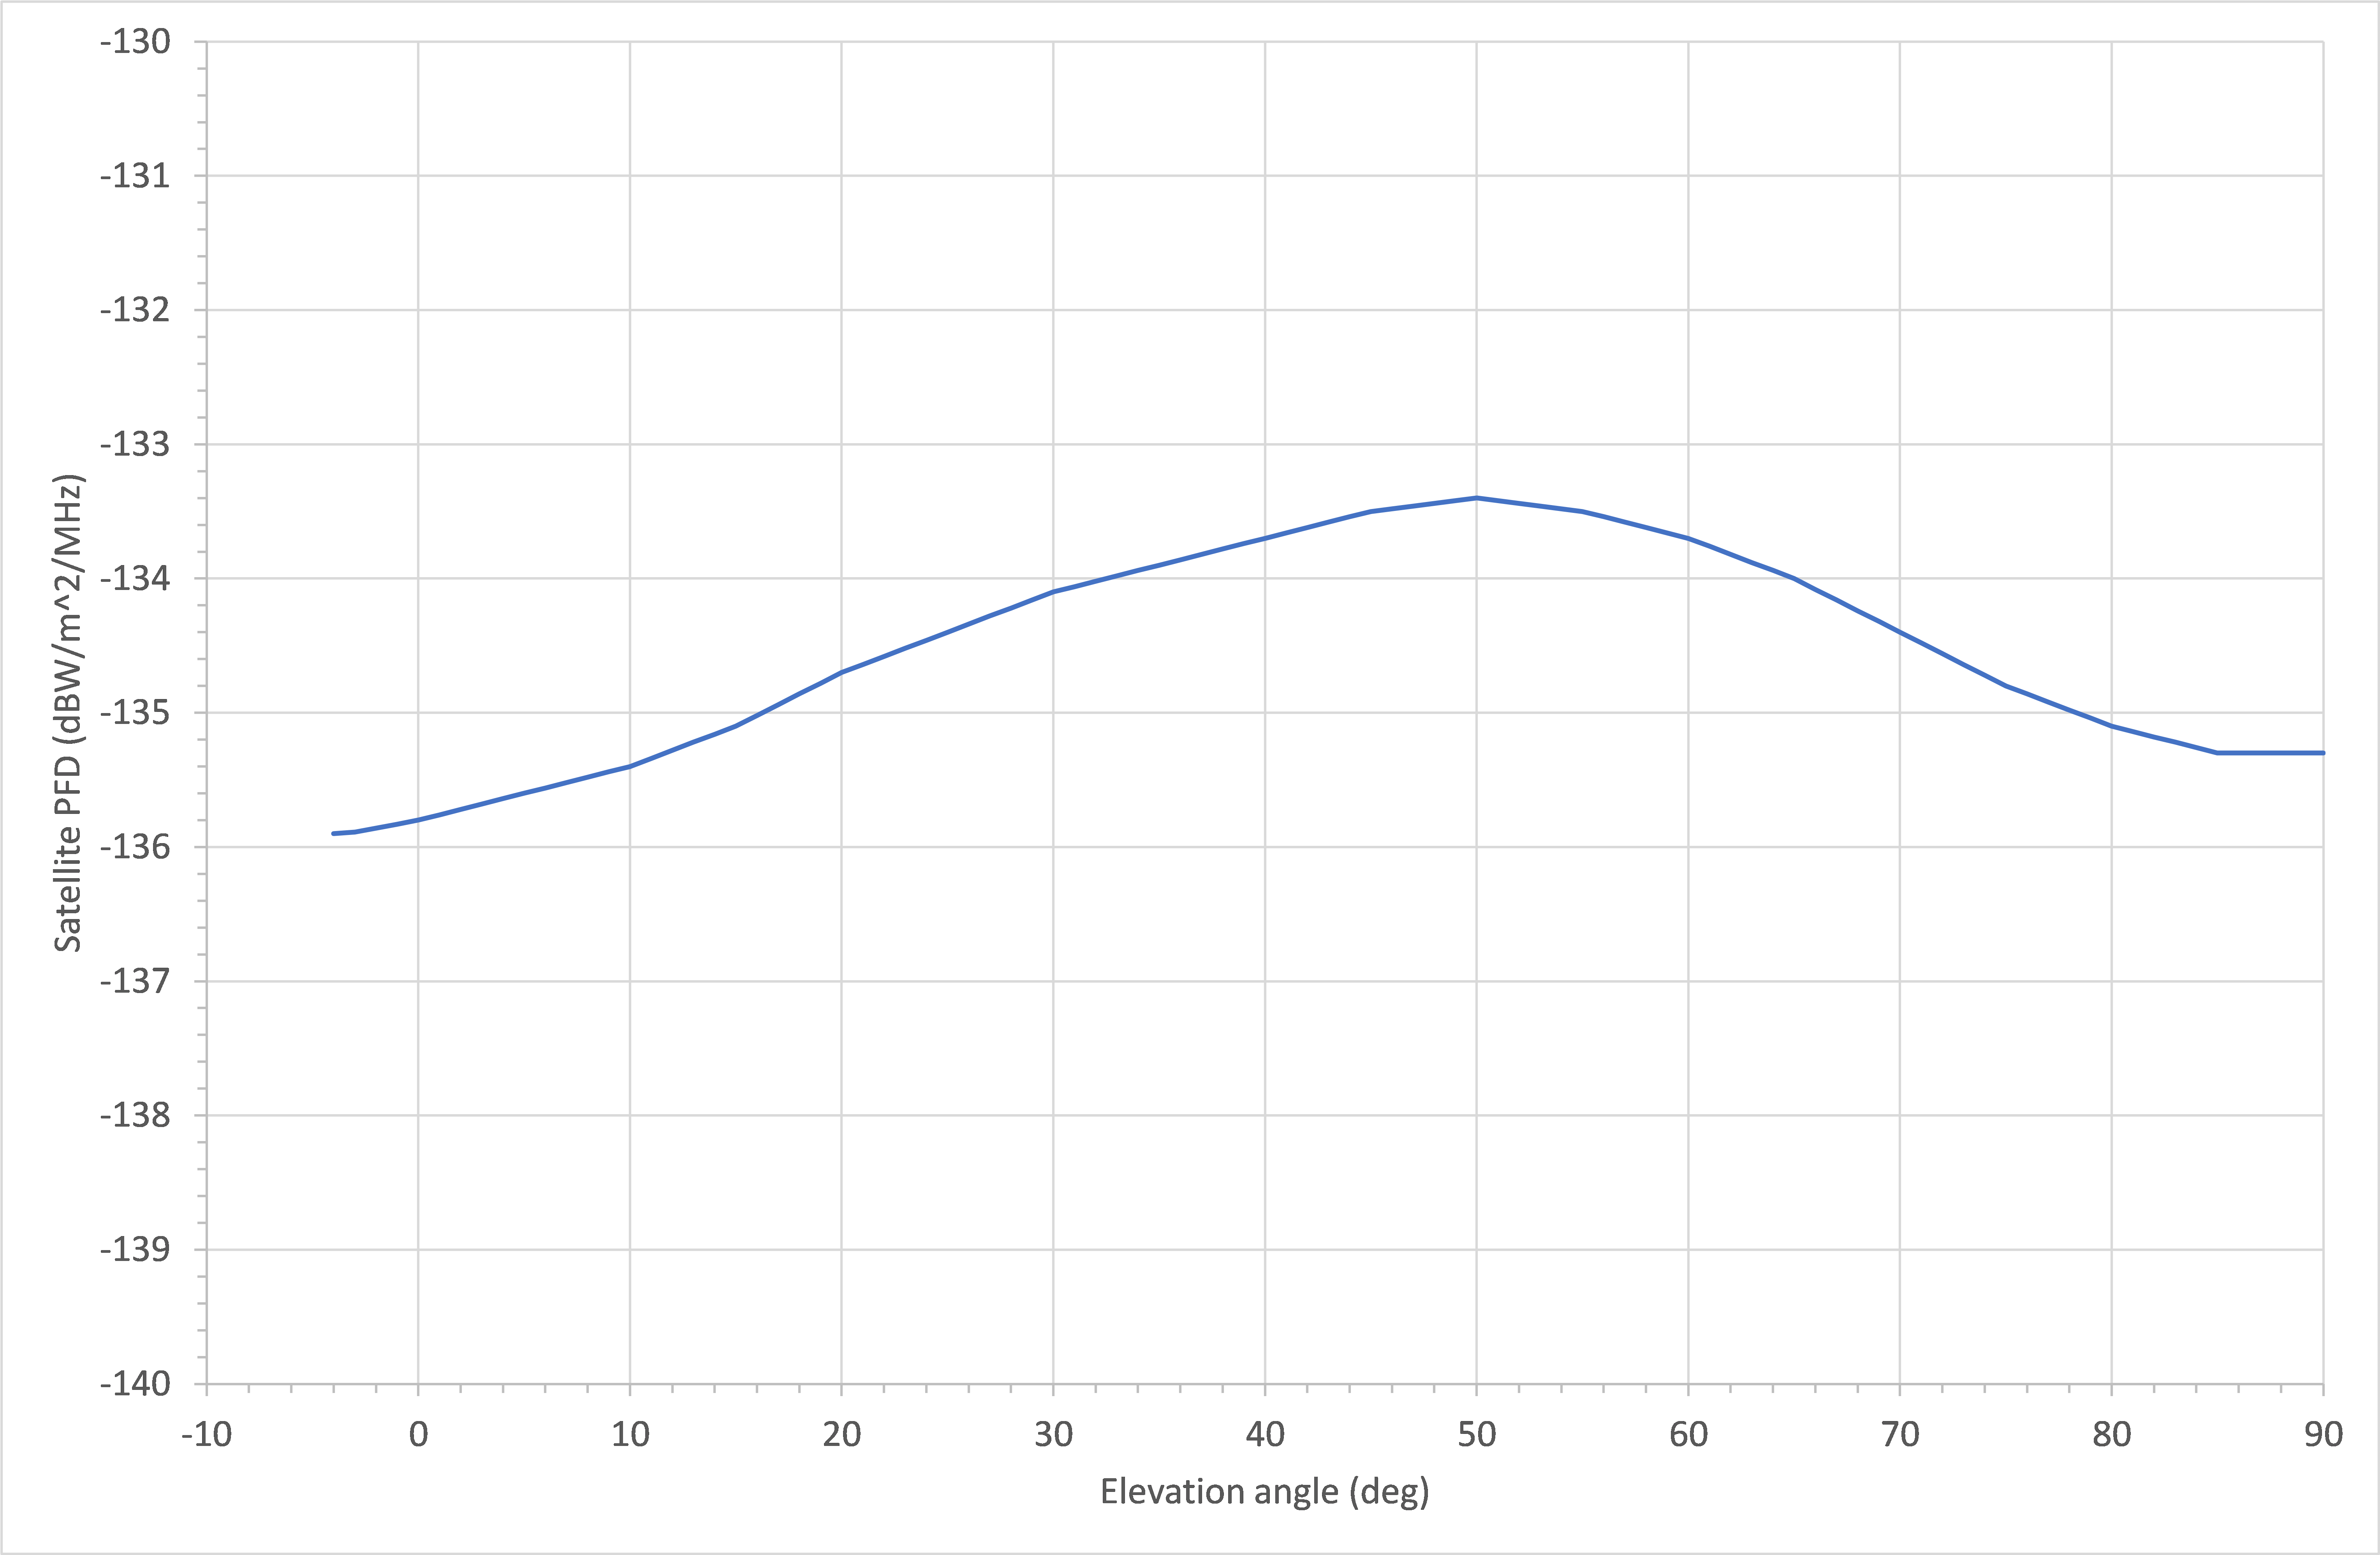
The satellite orbit parameters were read from the SRS for system GALILEO-2 and with a grid of test points the simulation was as shown in the figure below:
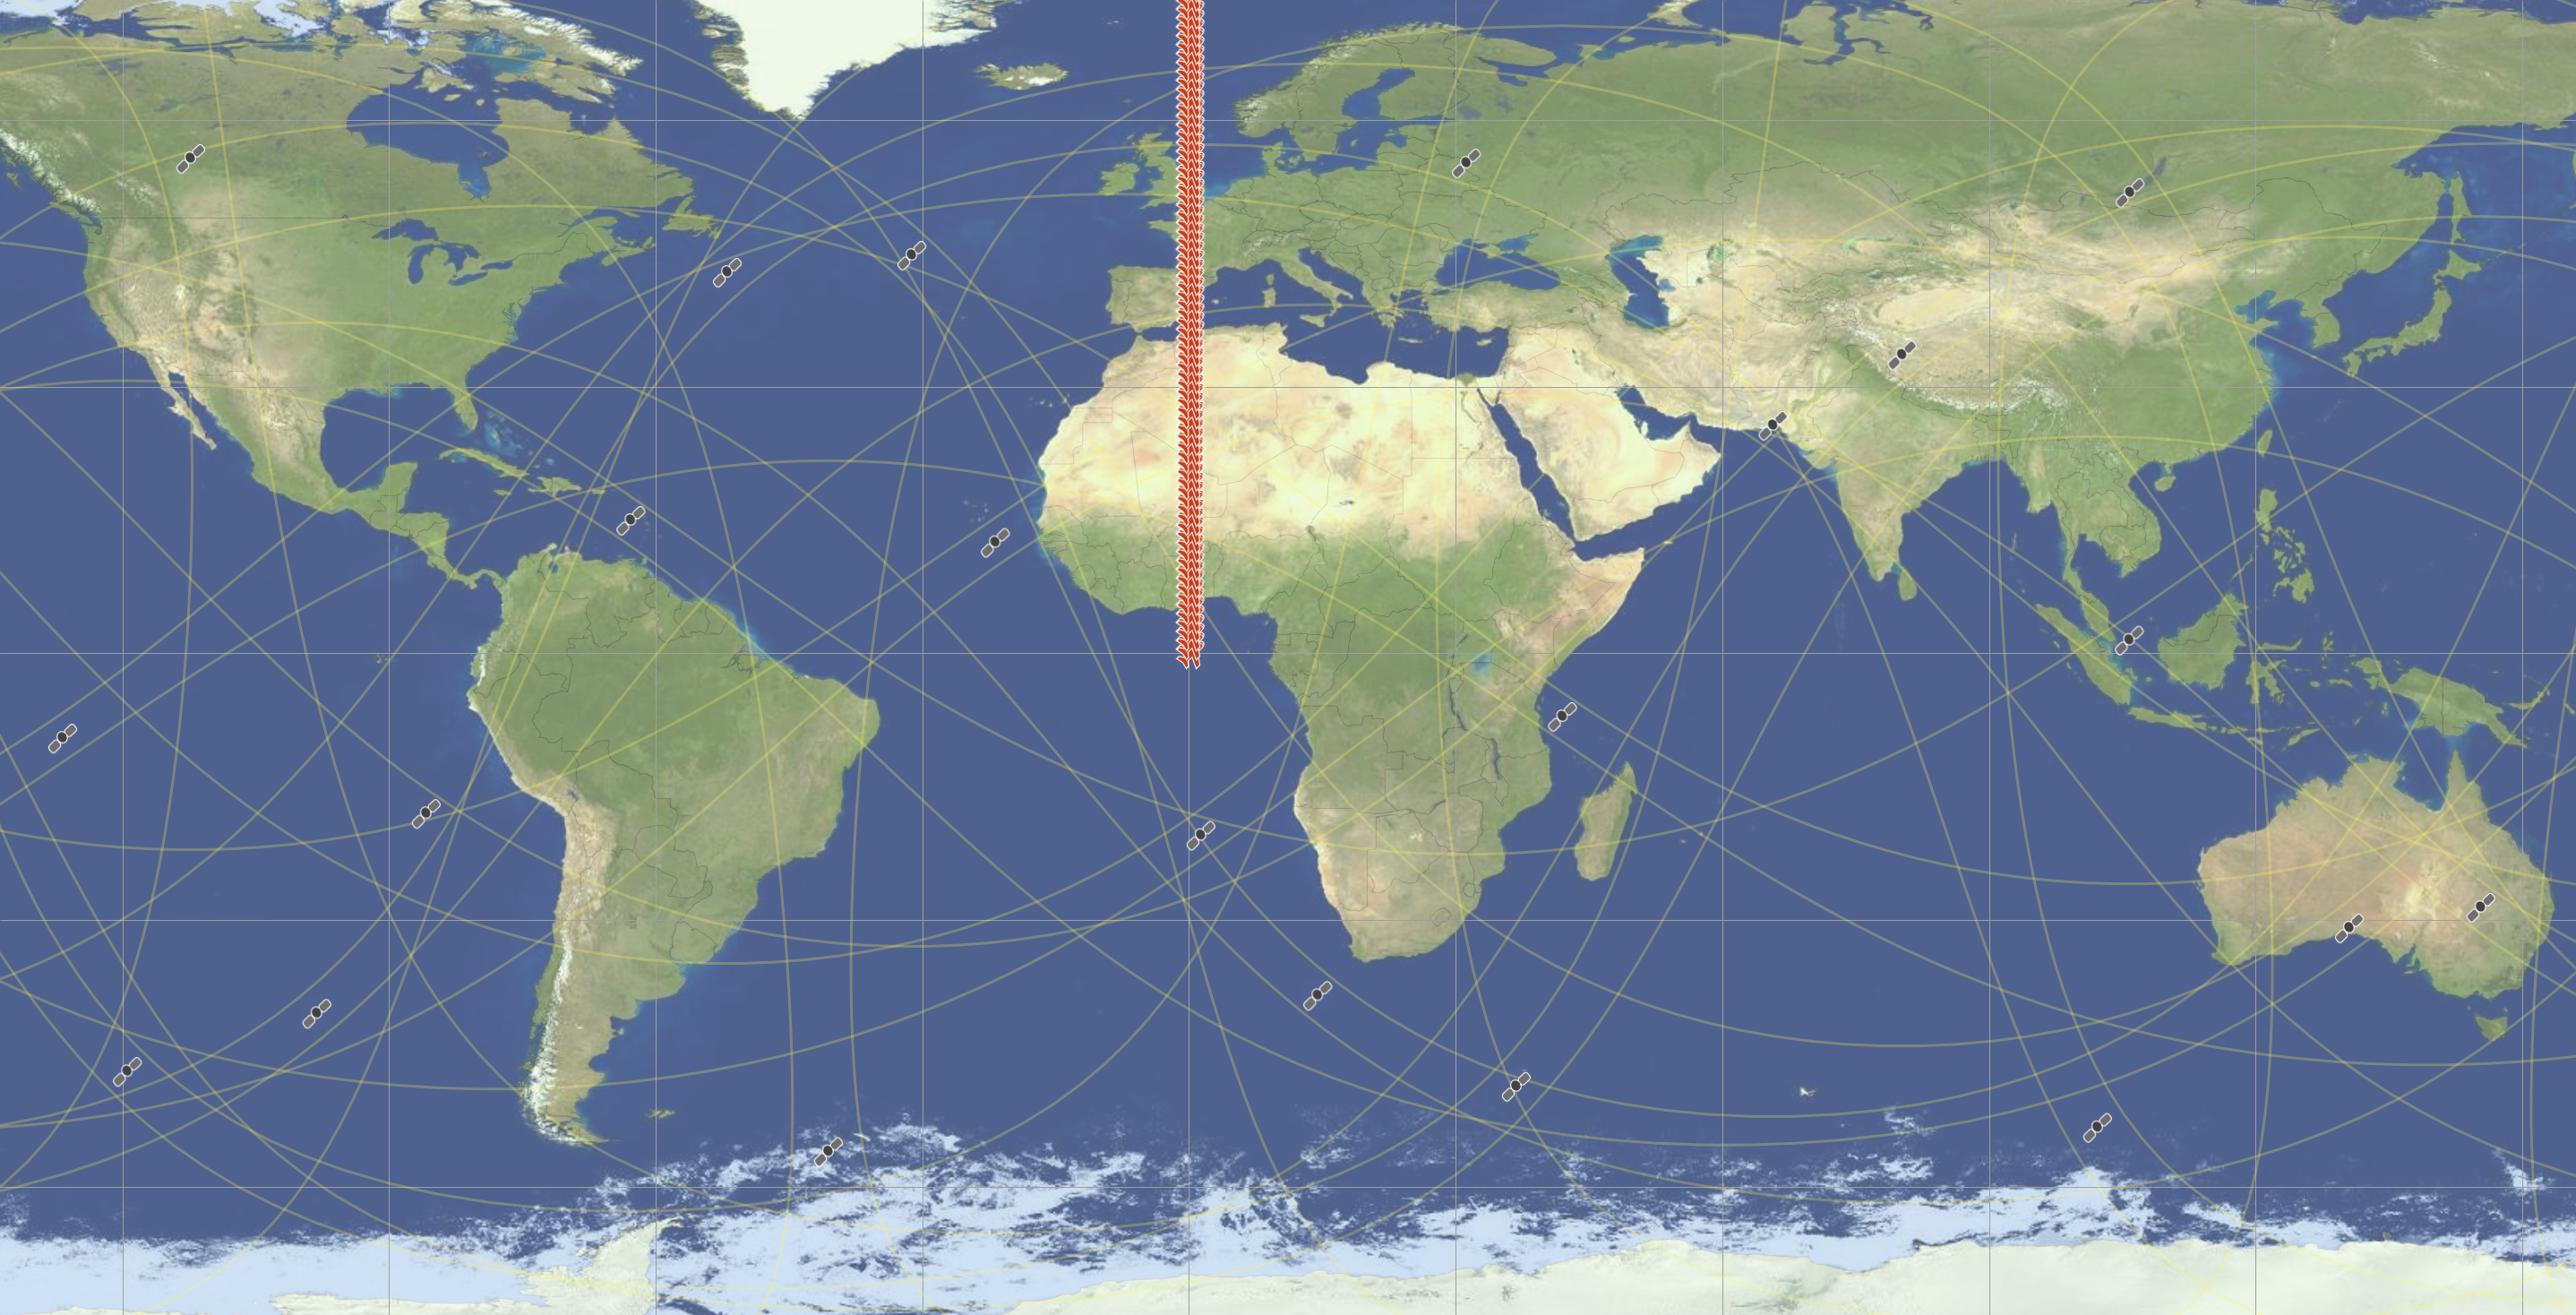
The simulation was run in Monte Carlo mode for 1,000,000 samples and the maximum epfd at each latitude calculated.
It was then compared with the input to the Resolution 609 process, as shown in the figure below.
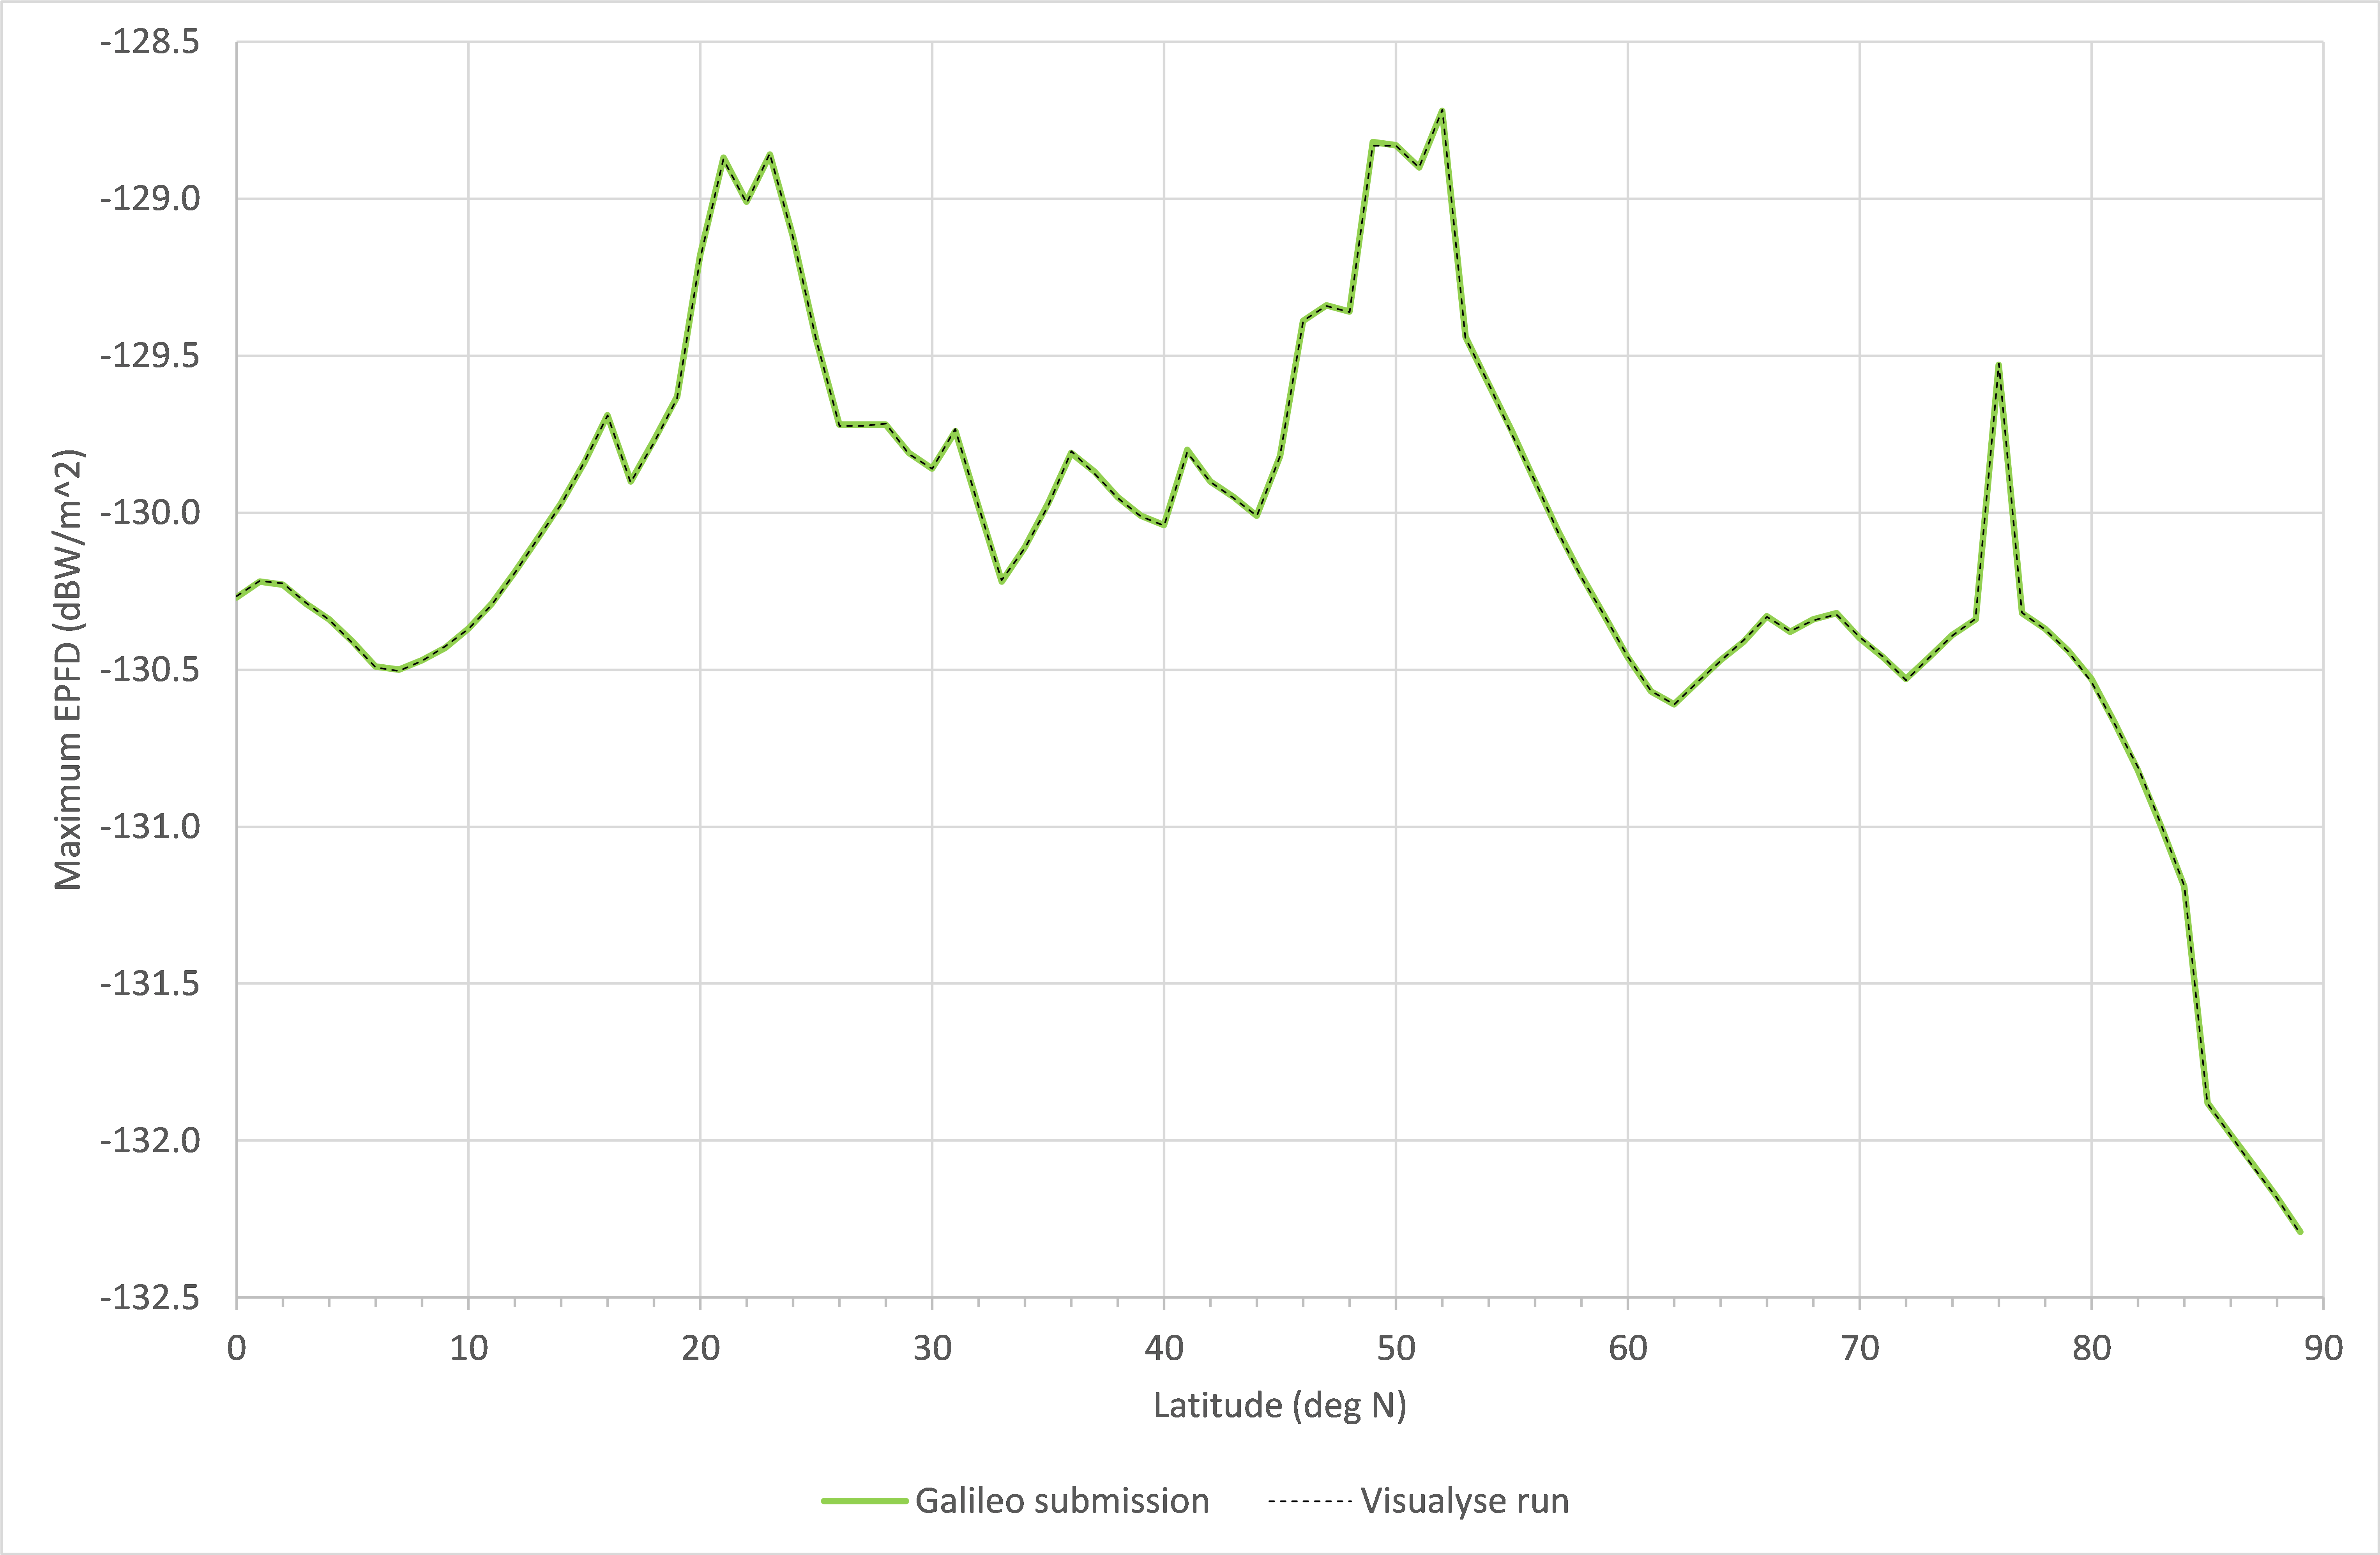
It can be seen that there is very good agreement, with maximum delta of 0.012 dB.
Calculation of GDOP
A metric that is of interest to RNSS systems is the geometric dilution of precision (GDOP), as described in this reference:
https://en.wikipedia.org/wiki/Dilution_of_precision_(navigation)
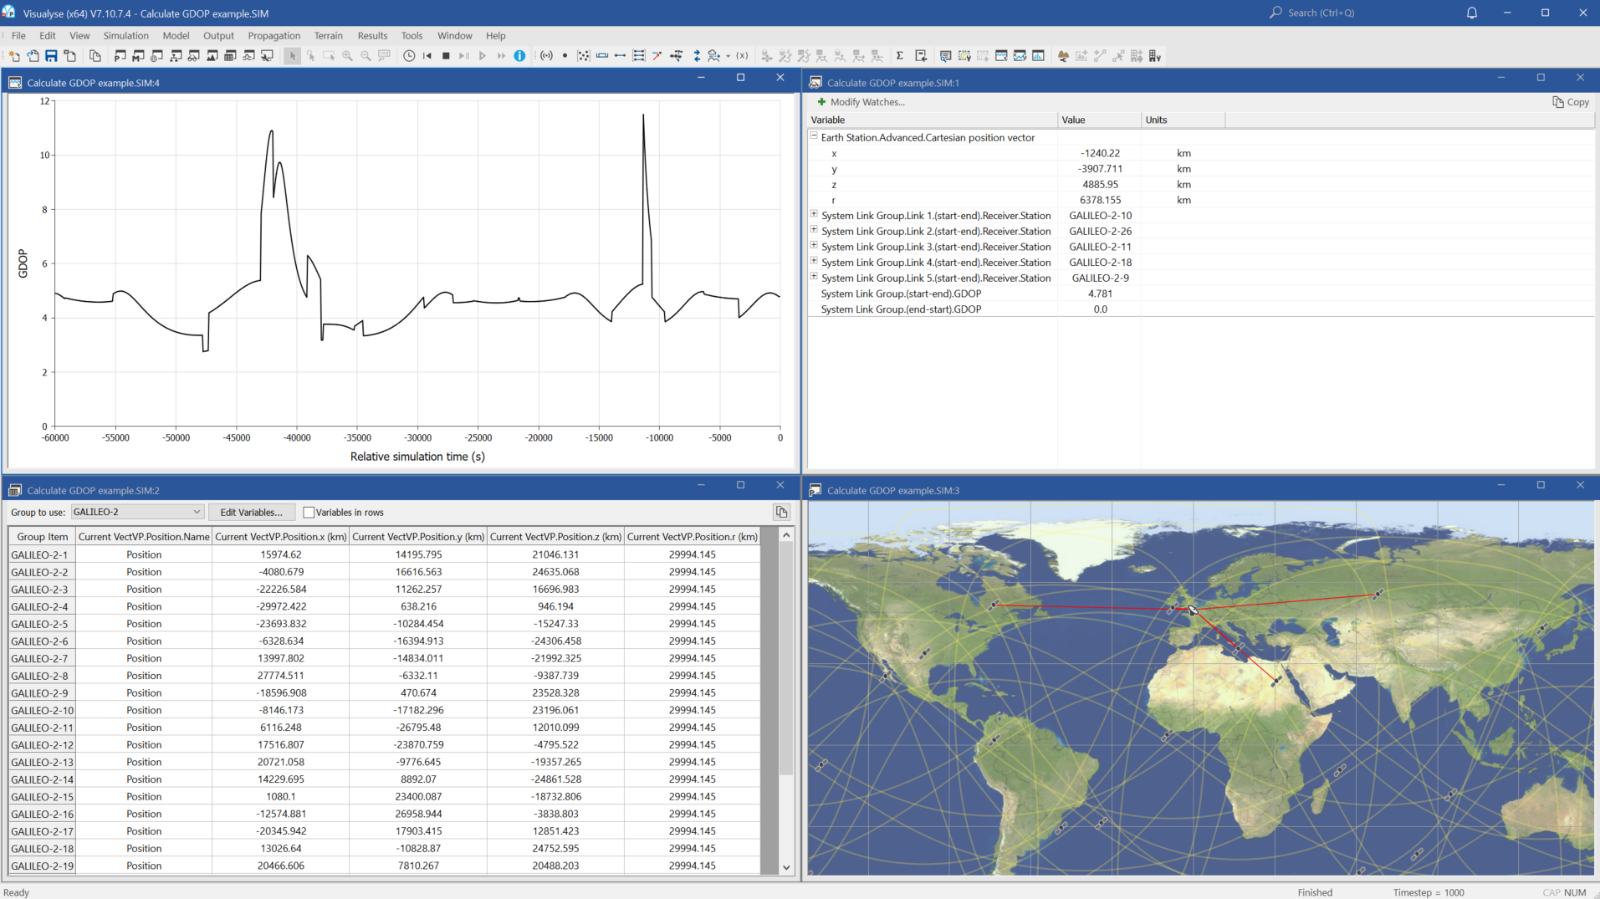
This metric has been added to the options in Visualyse tools in the Link Group, as shown in the figure below.
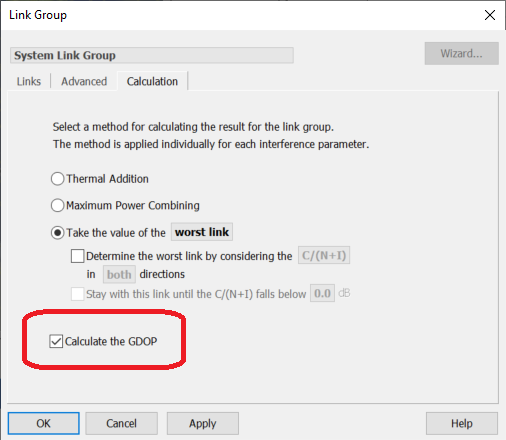
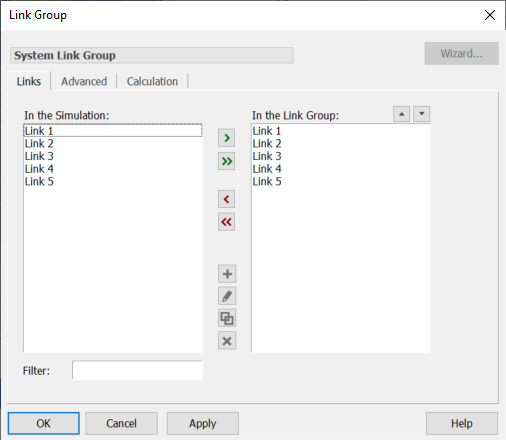
When selected, the GDOP is calculated over all the Links in the Link Group. For example, in this case, it would be calculated for 5 Links:
The GDOP is then available as a derived parameter under the Link Path and can be plotted, as in the figure below:
Use in Visualyse Interplanetary
Note that these features are available in both Visualyse Professional or Visualyse Interplanetary and hence could be used to analyse RNSS features around other celestial bodies, for example to assist in the design of a communications and navigation network around the Moon or Mars.
Consultancy Support
We can also use our Visualyse tools to undertake studies relating to RNSS including generation of the inputs required by Resolution 609 and representation at Resolution 609 meetings.